
Learning Modules Hide
Hide
- Chapter 1: Power of Combined Technical Indicators – Part 1
- Chapter 2: Power of Combined Technical Indicators – Part 2
- Chapter 3: Directional Movement System
- Chapter 4: Rate of Change Indicator (ROC)
- Chapter 5: Comparative Relative Strength Indicator
- Chapter 6: Types of Market Days – Part 1
- Chapter 7: Types of Market Days – Part 2
- Chapter 8: Pivot Points - Part 1
- Chapter 9: Pivot Points – Part 2
- Chapter 10: Value Area Trading – Part 1
- Chapter 11: Value Area Trading – Part 2
- Chapter 1: Introduction to Technical Analysis
- Chapter 2: Introduction to Charts and Chart Types
- Chapter 3: Trends, Support, and Resistances
- Chapter 4: Breakouts, Stops and Reversals
- Chapter 5: Fibonacci Retracements
- Chapter 6: Candlestick Patterns - One and Two Candle Patterns
- Chapter 7: Candlestick Patterns: Three Candle Patterns
- Chapter 8: Chart Patterns
- Chapter 9: Moving Averages and Crossovers
- Chapter 10: Price Volume Confirmation
- Chapter 11: Technical Indicators - Part 1: MACD and Stochastics
- Chapter 12: Technical Indicators - Part 2: Bollinger Bands and Relative Strength Index (RSI)
- Chapter 13: Do’s and Don’ts for Effective Trading Using Technical Analysis
Chapter 12: Technical Indicators - Part 2: Bollinger Bands and Relative Strength Index (RSI)
We introduced some indicators like the MACD and stochastics in the earlier chapters. By now, you must have realized that most of these indicators involve lines that run all over the charts. You need to understand that these indicators are independent trading systems identified and developed by technical traders. Most of these indicators carry a pre-defined logic in them. All these indicators help buy, sell, confirm trends, and forecast them.
Now, look at two more key indicators – Bollinger Bands and the RSI.
Bollinger Bands
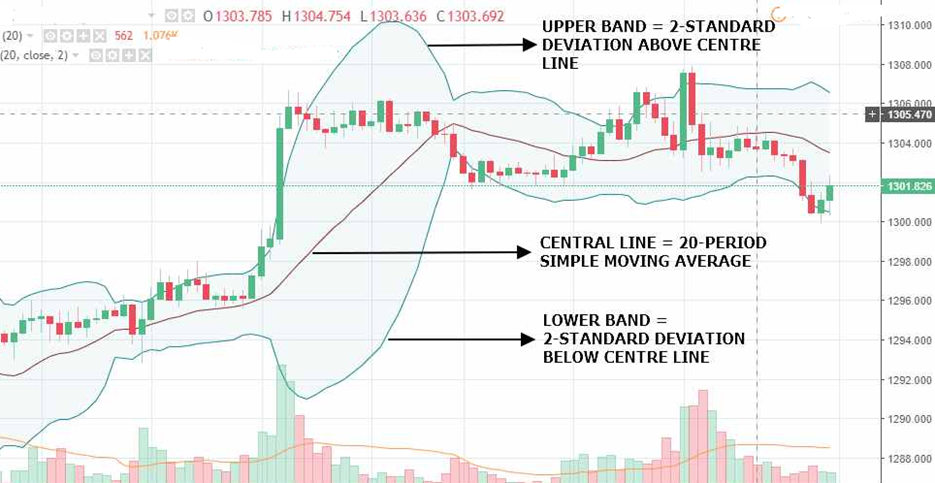
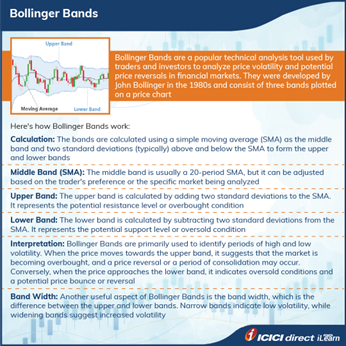
Bollinger Bands is a technical analysis tool that John Bollinger developed in the 1980s. It is used to measure the volatility of stocks, currency pairs, and other financial assets, by creating a band or envelope around the asset’s price.
Bollinger Bands consist of three lines:
- The middle line is a simple moving average (SMA) of the asset's price over a specific period, typically 20 days.
- The upper band is a line plotted 2 standard deviations above the SMA.
- The lower band is a line plotted 2 standard deviations below the SMA.
The gap / distance between the upper and lower bands reflects the asset’s volatility level. When the price is more volatile, the bands widen; the bands narrow when the price is less volatile. Traders use Bollinger Bands in technical analysis to identify potential buying or selling opportunities. One common approach is looking for a "squeeze," which occurs when the bands narrow, indicating that volatility decreases. Traders often interpret a squeeze as a signal that a breakout or significant price move may occur.
Another approach is to look for "oversold" or "overbought" conditions. If the price of an asset reaches the upper band, it may be considered overbought, and a trader may look for a potential sell signal. Conversely, if the price goes to the lower band, it may be considered oversold, and a trader may look for a possible buy signal.
Although the formula uses ‘+ / - 2’ standard deviations, we can also use ‘+/- 3’ standard deviations to identify more over-bought and over-sold zones.
It's important to note that Bollinger Bands must be combined with other technical indicators as it needs to be more foolproof.
Did you know?
John Bollinger, the creator of Bollinger Bands, is an American author and a financial analyst. His book ‘Bollinger on Bollinger Bands’ is translated into eleven languages. This tool was first introduced to the public through ‘The Financial News Network’; these bands didn’t have a name then. When an interviewer asked about the name of these bands, John Bollinger replied let’s call them Bollinger Band.
Now let us focus on another key technical analysis indicator – the Relative Strength Index (RSI).
Relative Strength Index
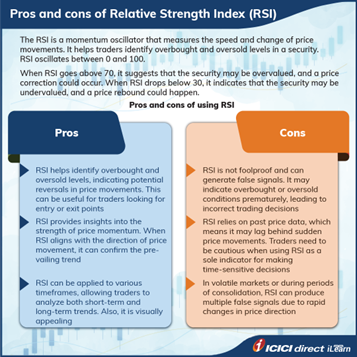
The relative strength index (RSI) is a technical analysis tool used to measure the strength of a financial asset's price action and to identify overbought or oversold conditions. It was developed by J. Welles Wilder Jr. in the late 1970s and is now widely used by traders and investors worldwide.
The mathematical formula for calculating RSI considers an asset’s average gains and losses over a given period, usually 14 days. The RSI value ranges from 0 to 100 and is plotted below the asset's price.
The RSI formula involves the following steps:
- Calculate the average gain and average loss over the specified period. The average gain is calculated by adding up all the positive price changes and dividing by the number of periods. The average loss is calculated by adding up all the negative price changes and dividing by the number of periods.
- Calculate the relative strength (RS) by dividing the average gain by the average loss.
- Calculate the RSI using the following formula: RSI = 100 - (100 / (1 + RS))
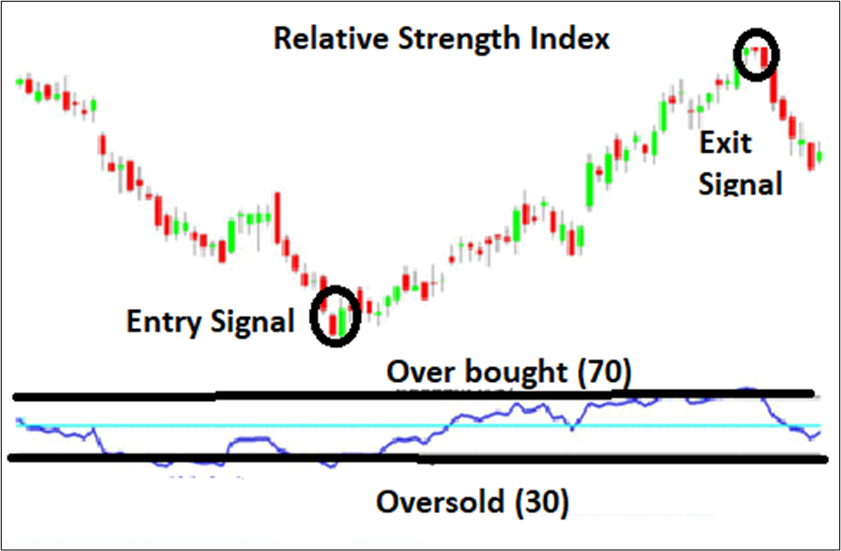
The RSI often identifies overbought or oversold conditions in an asset's price action. An asset is considered overbought when its RSI value is above 70, which indicates that it may be due for a price correction or reversal. An asset is considered oversold when its RSI value is below 30, which suggests that it may be due for a price rebound or reversal.
Look at this basic chart showing RSI:
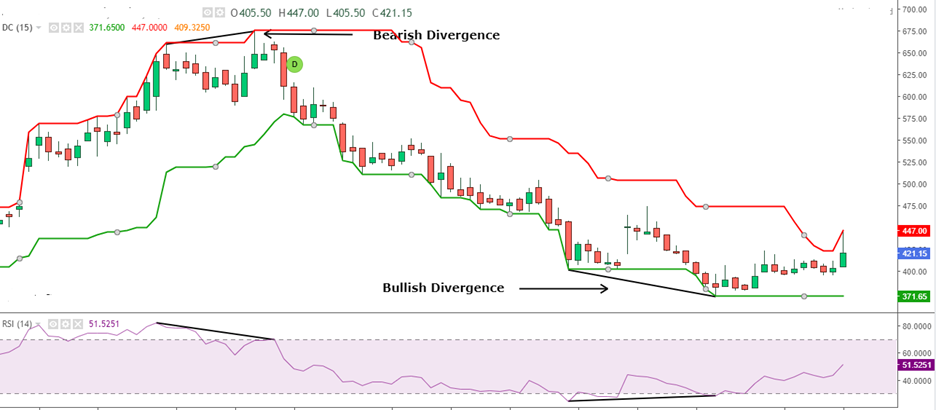
Let’s dive deep to understand this tool even better. Traders may use the RSI with other technical analysis tools, such as moving averages, chart patterns, and trendlines, to confirm their trading decisions. For example, a trader may look for a bullish divergence between the RSI and the price chart, which occurs when the RSI is making higher lows while the price is making lower lows, indicating a potential trend reversal. On the other hand, a bearish divergence occurs when the RSI makes lower highs while the price is making higher highs, indicating a possible trend reversal to the downside.
Look at the following image to understand the above example:
It's important to note that, like all technical analysis tools, the RSI needs to be foolproof and should be used with other forms of analysis to make informed trading decisions. Additionally, traders should be aware that the RSI can give false signals in certain market conditions, such as during a strong trending market, and should be used with caution. Also, you should note that RSI can stay at its peak and the bottom level for some time.
Classification of indicators - leading and lagging
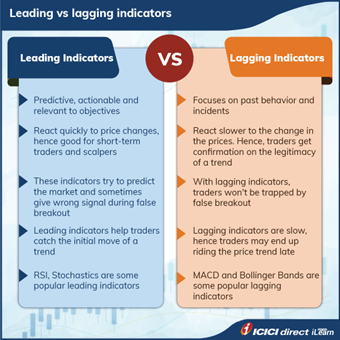
Technical indicators can broadly be classified into Leading and Lagging indicators.
Leading indicators are technical tools designed to provide early signals of a potential trend reversal or the beginning of a new trend before it happens. These indicators are based on current market data and attempt to predict future price movements. Leading indicators include tools such as oscillators (e.g., Stochastic oscillator, Relative Strength Index) and chart patterns (e.g., head and shoulders, triangles).
Lagging indicators, on the other hand, are technical tools that provide signals of a trend reversal or confirmation of a trend after it has already begun. These indicators are based on historical price data and must catch up to the current market trend. Examples of lagging indicators include moving averages, Bollinger bands, and the MACD.
Leading and lagging indicators can be helpful in technical analysis but have different strengths and weaknesses. Leading indicators can provide traders with early signals of potential trend reversals or new trends, allowing them to take advantage of these movements before they happen. However, leading indicators are more prone to false signals and can be less reliable in choppy or sideways markets.
Lagging indicators, on the other hand, tend to be more reliable in confirming a trend and can provide a better overall picture of the market trend. However, when a lagging indicator provides a signal, a significant portion of the trend may have already passed, potentially resulting in missed opportunities for traders. Ultimately, traders and investors need to carefully consider their trading strategies and goals when deciding which indicators to use in their analysis. Using a combination of leading and lagging indicators and other forms of analysis can help traders make more informed trading decisions and manage risk more effectively.
Let us quickly summarize our key learnings from this chapter.
Summary
- Bollinger Bands is a technical analysis tool that John Bollinger developed in the 1980s. It is used to measure the volatility of a stock by creating bands/ areas around the price.
- Traders use Bollinger bands to identify overbought and oversold assets. Price reaching the upper band signals a potential sell, while a drop to the lower band may be a buy signal.
- An asset is considered overbought when its RSI value is above 70, which indicates that it may be due for a price correction or reversal. An asset is considered oversold when its RSI value is below 30, which suggests that it may be due for a price rebound or reversal.
- Leading indicators are technical tools that are designed to provide early signals of a potential trend reversal or the beginning of a new trend before it happens.
- Lagging indicators are technical tools that signal a trend's reversal or confirmation of a trend after it has already begun.
The upcoming chapter will focus on effective trading using Technical Analysis and provide some guidelines on what to do and what not to do.


Please Enter Email


COMMENT (0)