-202606161502166115397.jpg)
L&T Q1FY27: PAT up 14% to ₹4,123 Cr, Revenue Rises 7% to ₹67,942 Cr
 29-07-2026 09:17:00 ICICI Securities


Welcome back! You already have an account with ICICI Direct.
Generate PasswordWelcome back! You already have an account with ICICI Direct.
LoginWelcome back! You already have an account with ICICI Direct.
LoginSign up for a new account
 Please accept the declaration.
 Please wait!
These terms and conditions ("WhatsApp Terms and Conditions" as amended from time to time) are applicable to the Customers (defined hereinafter) that avail the Services (defined hereinafter) provided thereon by ICICI Securities Limited ("ICICI Securities") on the WhatsApp platform.
The WhatsApp Terms and Conditions shall be in addition to any other terms and conditions as stipulated by the ICICI Securities from time to time on its website (www.icicidirect.com) whether pertaining to the account or in relation to other products, services or facilities provided by ICICI Securities.
Any services that may be offered to the customer through the WhatsApp platform ("WhatsApp") is at the discretion of the ICICI Securities and/or basis the eligibility criteria of a customer and such services are subject to certain terms and conditions. In case of conflict between any of these WhatsApp Terms and Conditions and the terms and conditions for other services provided on the WhatsApp channel, specific terms and conditions of such services shall prevail.
Further, in case of inconsistency between the WhatsApp Terms and Conditions and any specific terms and conditions pertaining to account or any specific service/product/offer, the specific terms and conditions of that particular service/product/offer shall prevail.
1. DEFINITIONS
"Trading Account" refers to the trading account maintained by the Customer with ICICI Securities.
"Trading Account Related Services" shall mean the Services which pertain to information in relation to the Trading Account maintained with ICICI Securities by customer including but not limited to portfolio valuation, stock quote, order details, trade details etc which are enabled by ICICI Securities, from time to time, at its sole discretion.
"Registered ICICI Securities Number" is the authorized number of ICICI Securities, registered with WhatsApp for the purposes of providing Services herein.
"Customer" shall mean any person holding Trading Account or any prospective customer with ICICI Securities and interacting with ICICI Securities on WhatsApp using the Registered ICICI Securities Number / using the Services provided by ICICI Securities through WhatsApp. "Customer Information" refers to the personal data or information or such other data or information including any sensitive personal data in relation to the Customer such as information in relation to the trading account of the Customer, shared by the Customer or provided to the Customer by ICICI Securities or collected or obtained from the Customer or from WhatsApp or from any such source in the course of the Customer availing the Services hereunder.
"One Way Communication" shall mean the service provided by ICICI Securities to the Customer on WhatsApp where ICICI Securities sends its Customer one-way messages through its Registered ICICI Securities Number in the nature of information, alerts, updates, transaction alerts in relation to the Customer's Trading Account and such other communications as ICICI Securities may enable from time to time, at its discretion.
"Privacy Policy/Privacy Commitment" shall have the meaning as ascribed on the Website; "Service(s)" shall mean the One Way Communication and Two Way Communication services provided by ICICI Securities by itself or through any of its service providers, to a Customer on WhatsApp.
"Two Way Communication" shall mean the service provided by ICICI Securities to the Customers on WhatsApp where the Customer can communicate with ICICI Securities by sending it messages in the form of making requests, seeking information, asking queries etc. on the Registered ICICI Securities Number and where ICICI Securities responds to such messages. However, this service and ICICI Securities responses shall be limited only to such queries, information, requests etc. as may be determined by ICICI Securities from time to time, at its sole discretion.
"WhatsApp" is the application provided by WhatsApp Inc. 1601 Willow Road, Menlo Park, California 94025.
2. INTERPRETATION
3. PURPOSE
This WhatsApp platform serves as a supplementary medium through which we can communicate with you and provide Services and further enable certain services as ICICI Securities may decide in its sole discretion.
4. ELIGIBILITY FOR USING THE SERVICES
The Customer hereby agrees and undertakes that he/she shall use the Services only if he/she fulfills the eligibility as given below:
5. APPLICABILITY OF WHATSAPP TERMS AND CONDITIONS
These WhatsApp Terms and Conditions form a contract between the Customer and ICICI Securities. The Customer shall apply to ICICI Securities in the prescribed manner for availing of the Services. By applying and opting in for the Services, the Customer acknowledges that he has read, understood and accepted these WhatsApp Terms and Conditions and other specific terms and conditions as pertaining to the Account and any other products/offers/facilities and services availed by the Customer whether or not through WhatsApp.
No act, delay or omission by ICICI Securities shall affect its rights, powers and remedies under these Terms and Conditions and other terms on ICICI Securities website (www.icicidirect.com), hereinafter referred to as "Website".
The Customer hereby accepts and agrees that all Services and communications (both One Way Communication and Two Way Communication) taking place on WhatsApp, initiated either by ICICI Securities or the Customer, will be governed by and subject to these WhatsApp Terms and Conditions. Further, the Customer hereby agrees that the Customer grants express authority to ICICI Securities for carrying out the Services requested by the Customer on WhatsApp on its Registered ICICI Securities Number. Provided however that ICICI Securities shall not be required to authenticate the Customer, if any request for the Services comes on WhatsApp to ICICI Securities Registered Number, and in case of a Customer, if the number reflected in the requestor's mobile is a Customer's Registered Number, ICICI Securities shall be entitled to presume that it is the Customer itself which is interacting through WhatsApp and in case of any other Customer ICICI Securities shall be entitled to presume that the number reflected in the WhatsApp profile is the Customer's number and it is the Customer itself and not any other person who is interacting with ICICI Securities Registered Number. ICICI Securities's own record or log of transactions maintained through computer systems or otherwise shall be accepted as conclusive and binding for all purposes.
6. SERVICES
The Customer agrees and accepts that ICICI Securities reserves the right to provide only such Services as ICICI Securities may at its discretion permit from time to time. ICICI Securities may also inform/update the availability/non-availability of any particular Service, at its sole discretion. The Customer hereby agrees that ICICI Securities may at any time, without notice to the Customer, modify, discontinue or make additions/deletions to the Services offered to the Customer. The Customer agrees that he shall not hold ICICI Securities responsible for not responding to the queries of/ information sought by the Customer or not providing a response to the satisfaction of the Customer or not processing any request of the Customer, in case such a message sent by the Customer in case ICICI Securities does not receive an instruction to this effect in its systems or the message sent by the Customer is not in the format as required by ICICI Securities or does not fall under the Services being offered by ICICI Securities at the time or ICICI Securities does not receive such a message for technical reasons or otherwise or for any reason whatsoever. ICICI Securities will have no liability in case of any fraud or impersonation incidents through the WhatsApp platform. Further, in case ICICI Securities permits any Service in the nature of a transaction, the Customer agrees that such a Service shall be subject to statutory/ regulatory limits and/or any limits that may be imposed by ICICI Securities, from time to time, at its sole discretion.
7. REGISTRATION AND VERIFICATION
For availing the One Way Communication and Two Way Communication service, the Customer agrees and confirms to have accepted (a) the WhatsApp Terms and Conditions applicable to the Customer for availing the Services mentioned herein; (b) the Privacy Policy of ICICI Securities applicable to the Customer for availing the Services mentioned herein; (c) any other Account/product/service/offer related specific terms and conditions as applicable and (d) all terms and conditions prescribed by WhatsApp for using its platform.
Provided that, ICICI Securities may modify the process for authentication, registration and/or verification of the Customer, for One Way Communication and/or Two-Way Communication, at any time, at its sole discretion.
8. UNSUBSCRIBE
You may choose/request for de-registration/un-subscription of the Services at any point of time by following the process as may be prescribed by ICICI Securities from time to time. Currently ICICI Securities provides the following channels for un-subscription:
However, the Customer agrees that for this to come into effect, it may take such time as may be required by ICICI Securities. The Customer agrees that he will remain responsible for any requests made/ messages sent to ICICI Securities using the Services prior to the time such cancellation of the Services is effected by ICICI Securities. ICICI Securities will be at liberty to discontinue/ suspend/ terminate the Customer's use of the Services at any time without assigning any reason whatsoever. ICICI Securities may also discontinue or suspend or terminate Services/ facilities without prior notice if these Terms and Conditions are breached.
Once we have received the notification that you have unsubscribed, we will no longer process your information for the purpose(s) you originally agreed to and sent any further notification/message through WhatsApp, unless legally permissible otherwise.
9. IMPORTANT
ICICI Securities shall not be responsible or liable to the Customer or any third party for the consequences arising out of or in connection with using of this Service. The Customer should immediately opt-out of the Services as per the unsubscribe process as detailed in section 8 above.
10. THIRD PARTY
WhatsApp is owned by a third-party unaffiliated with ICICI Securities. The Customer shall independently be guided by the privacy policies of WhatsApp and the third parties or group companies of WhatsApp and ICICI Securities has no control over them. ICICI Securities is not responsible for the privacy or security policies at these sites or other third-party sites that may be linked to within ICICI Securities's social media channels. The Customer should always review the privacy and security practices and policies of each third-party site you visit. ICICI Securities does not endorse and is not responsible for any ads, content, products, advice, opinions, recommendations or other material of third-party sites that may be promoted via advertising within any social media channels.
WhatsApp is owned by a third-party unaffiliated with ICICI Securities. The Customer shall independently be guided by the privacy policies of WhatsApp and the third parties or group companies of WhatsApp and ICICI Securities has no control over them. ICICI Securities is not responsible for the privacy or security policies at these sites or other third-party sites that may be linked to within ICICI Securities's social media channels. The Customer should always review the privacy and security practices and policies of each third-party site you visit. ICICI Securities does not endorse and is not responsible for any ads, content, products, advice, opinions, recommendations or other material of third-party sites that may be promoted via advertising within any social media channels.
The Customer further understands and agree that WhatsApp or any other service provider through which we are providing the WhatsApp facility can review and monitor, store the contents shared/communicated through the WhatsApp or other service provider(s) and may share the same with third parties.
Hence, we strongly recommend that you:
11. DISCLAIMER OF LIABILITY
ICICI Securities shall not be responsible for any failure on the part of the Customer to utilize the WhatsApp facility due to the Customer not being within the geographical range within which the WhatsApp facility is offered and which forms part of the roaming network of such cellular service provider, providing services to the Customer availing such roaming facility from the respective cellular service provider. If the customer has reason to believe that the mobile phone number is / has been allotted to another person and / or there has been an unauthorized transaction in the account and / or his mobile phone handset is lost, he shall immediately inform ICICI Securities of the same.
The Customer agrees that ICICI Securities shall not be liable if:
ICICI Securities shall endeavor to provide the WhatsApp facility on a best effort basis and the Customer shall not hold ICICI Securities liable for non-availability of the WhatsApp facility or non-performance by service providers, if any, engaged by ICICI Securities or any loss or damage caused to the Customer as a result of use of the WhatsApp facility for causes which are not attributable to ICICI Securities. ICICI Securities shall not be liable in any manner to the Customer in connection with the use of the WhatsApp facility.
ICICI Securities shall endeavor to carry out the instructions received from the Customer through the WhatsApp channel promptly, provided that ICICI Securities, shall not be responsible for the delay in carrying out such instructions due to any reason whatsoever, including, but not limited to, failure of operational system or any requirement of law or ICICI Securities's internal policies.
The Customer accepts that each WhatsApp communication may contain certain account information relating to the Customer. The Customer authorizes ICICI Securities to send account related information, though not specifically requested, if ICICI Securities deems that the same is relevant.
ICICI Securities shall not be held responsible for the confidentiality, secrecy and security of the personal or account information being sent through the WhatsApp facility. The Customer agrees that the access to the WhatsApp facility shall be only through the Registered Customer Number and any transaction which originates from the same, whether initiated by the Customer or not, shall be deemed to have originated from the Customer.
Under no circumstance, ICICI Securities shall be held liable if the WhatsApp facility is not available for reasons including but not limited to natural calamities, epidemic/pandemic, legal restraints, faults in the telecommunication network or network failure, or any other reason beyond the control of ICICI Securities. ICICI Securities shall not be liable under any circumstances for any damages whatsoever whether such damages are direct, indirect, incidental consequential and irrespective of whether any claim is based on loss of revenue, interruption of business or any loss of any character or nature whatsoever and whether sustained by the Customer or by any other person. Illegal or improper use of the WhatsApp facility shall render the customer liable for payment of financial charges as decided by ICICI Securities or will result in suspension of the WhatsApp facility for the Customer.
ICICI Securities is in no way liable for any error or omission in the services provided by any cellular or any third party service provider (whether appointed by ICICI Securities in that behalf or otherwise) to the Customer, which may affect the WhatsApp facility.
ICICI Securities, does not warrant the confidentiality or security of the messages whether personal or otherwise transmitted through the WhatsApp facility. ICICI Securities makes no warranty or representation of any kind in relation to the system and the network or their function or performance or for any loss or damage whenever and howsoever suffered or incurred by the Customer or by any person resulting from or in connection with the WhatsApp facility.
Without limitation to the other provisions of these WhatsApp Terms and Conditions, ICICI Securities, its employees, agent or contractors, shall not be liable for and in respect of any loss or damage whether direct, indirect or consequential, including but not limited to loss of revenue, profit, business, contracts, anticipated savings or goodwill, loss of use or value of any equipment including software, whether foreseeable or not, suffered by the Customer or any person howsoever arising from or relating to any delay, interruption, suspension, resolution or error of ICICI Securities in receiving and processing the request and in formulating and returning responses or any failure, delay, interruption, suspension, restriction, or error in transmission of any information or message to and from the telecommunication equipment of the Customer and the network of any cellular service provider and ICICI Securities's system or any breakdown, interruption, suspension or failure of the telecommunication equipment of the Customer, ICICI Securities's system or the network of any cellular service provider and/or any third party who provides such services as is necessary to provide the WhatsApp.
Notwithstanding anything in the contrary provided in this terms and conditions, ICICI Securities shall not be involved in or in any way liable to the Customer for any dispute between the Customer and a cellular service provider or any third party service provider or WhatsApp (whether appointed by ICICI Securities for such purpose or otherwise) while availing these Services through the WhatsApp platform.
The Customer shall not interfere with or misuse in any manner whatsoever the WhatsApp facility and in the event of any damage due to improper or fraudulent use by the Customer, the Customer shall be liable for damages to ICICI Securities or for any losses suffered by ICICI Securities.
The Customer is solely responsible for protecting his/her OTP/debit card PIN/ password or mobile phone number and any other password and/or any other mode of verification as prescribed/ issued by ICICI Securities for the use of the WhatsApp facility from time to time without any liability of ICICI Securities in this regard. The Customer hereby agrees and accepts that he/she shall at all times be solely responsible for the protection and safe keep of his/her SIM card, Device and the applications installed thereon, specifically WhatsApp, login IDs, Customer Information, security details and passwords as mentioned hereinabove and hereby fully agrees that ICICI Securities shall in no manner be liable for any direct or indirect or consequential or other loss arising out of any action or omission because of compromise of the same in any manner whatsoever.
The Customer agrees that ICICI Securities assumes no liability whatsoever in case of any event of such compromise of the Customer's WhatsApp and ICICI Securities shall not be held responsible for any such event. Further, the Customer agrees and understands that WhatsApp can also be logged on from more than one device at the same time, including by using web log in and the Customer is aware of the risk in this regard while availing the Services such as compromise of Customer Information, breach of security of the Customer's WhatsApp account from a device other than the Customers and the Customer undertakes to be vigilant and careful and takes full responsibility for the security of his/her WhatsApp account. ICICI Securities shall not be responsible or liable to you or any third party for the consequences arising out of or in connection with using of this Service.
ICICI Securities will not be liable for:
ICICI Securities makes no representation or gives no warranty with respect to the quality of the service provided by any cellular service provider or by WhatsApp or any other service provider enabling ICICI Securities to deliver services through WhatsApp to the Customers.
ICICI Securities may provide any other services as a part of the WhatsApp facility and ICICI Securities shall not be liable for the oversight on part of the Customer to update himself /herself with the addition of services which have been included in the WhatsApp facility.
12. INDEMNITY
In consideration of ICICI Securities providing the WhatsApp facility, the Customer, at his own expense, agrees to indemnify, defend and hold harmless, ICICI Securities, its directors and employees, representatives, agents, customers and/or the affiliates, as the case may be, against all losses, damages, expenses, actions, claims, demands and proceedings whatsoever, that ICICI Securities may incur, sustain, suffer or be put to at any time as a consequence of acting on or omitting or refusing to act on any instructions given by the Customer or otherwise for use of the WhatsApp facility.
The Customer further specifically agrees to indemnify, defend and hold harmless, ICICI Securities and/or its affiliates from any losses occurring as a result of the:
13. TERMINATION
ICICI Securities may, at its discretion, withdraw temporarily or terminate the WhatsApp facility, either wholly or in part, at any time without giving prior notice to the Customer. ICICI Securities may, without prior notice, suspend the WhatsApp facility at any time during which any maintenance work or repair is required to be carried out or in case of any emergency or for security reasons, which require the suspension of the WhatsApp facility.
ICICI Securities may suspend or terminate WhatsApp facility without prior notice if the Customer has breached these WhatsApp Terms and Conditions or ICICI Securities learns of the death, bankruptcy.
14. PROPRIETARY RIGHTS
The Customer acknowledges that the software/ other internet related software which are required for providing the Services or any Intellectual Property Rights of ICICI Securities in the process are the legal property of ICICI Securities/ respective service providers. The permission given by ICICI Securities to avail of the Services to the Customer will/ does not create or convey any rights, title or interest to the Customer or to any person, in the above software or Intellectual Property Rights of ICICI Securities. The Customer agrees that he shall not attempt to modify, translate, disassemble, decompile or reverse engineer such software or create any derivative product based on the software.
15. DISCLOSURE
The Customer hereby expressly authorize and give consent to ICICI Securities to share, exchange, disclose, transfer or part with any of Trading Account information or personal data, contained provided to/ available with ICICI Securities, when ICICI Securities considers such disclosure as necessary or expedient, with:
For the purpose: -
16. GOVERNING LAW
These WhatsApp terms and conditions shall be governed by laws of India. Any dispute or differences arising out of or in connection with the WhatsApp facility shall be subject to the exclusive jurisdiction of the Courts of Mumbai. ICICI Securities accepts no liability whatsoever, direct or indirect for noncompliance with the laws of any country other than that of India. The mere fact that the WhatsApp facility can be accessed by a Customer in a country other than India does not imply that the laws of the said country govern these terms and conditions and / or the operations in the account/s/services/offers provided to the customer and / or the use of the WhatsApp facility.
DISCLAIMER:
I accept the terms and conditions and I have read the privacy policy.
I hereby understand and agree to authorize the ICICI Securities and its affiliates/ group companies to reach me/send any communication pertaining to my Account / Investments and related services/facilities/special offers, or any other relationship held by me with ICICI Securities or in relation to various products, offers and services provided by ICICI Securities /its group companies, through registered e-mail, phone, SMS or any other electronic mode or other messaging or social media platforms. ICICI Securities will be sending One Time Pin (OTP) on the registered mobile number. I understand and agree that the email provider or any other service provider can review/monitor the contents shared/communicated through email provider or other service provider. I understand that such electronic mode of communication(s) are subject to the terms and conditions of the respective service provider and agree to comply with the terms of use of email, SMS, or any other electronic mode, as applicable and updated/modified by the service provider from time to time. I hereby expressly authorize ICICI Securities to disclose, transfer or part with any of my information (including my sensitive personal information, location etc.) or any other device information when ICICI Securities considers such disclosure as necessary, with Agents of ICICI Securities in any jurisdiction; (ii) Auditors, credit rating agencies/credit bureaus (including but not limited to CIBIL), statutory/regulatory authorities, governmental/administrative authorities, Central Know Your Customer (C-KYC) registry , exchanges or SEBI Know Your Client registration agency, having jurisdiction over ICICI Securities; (iii)Service providers, professional advisors, consultants or such person with whom ICICI Securities contracts or proposes to contract.
FinAce
 29-07-2026 09:17:00 ICICI Securities
29-07-2026 09:16:00 ICICI Securities
29-07-2026 09:17:00 ICICI Securities
29-07-2026 09:16:00 ICICI Securities
 29-07-2026 09:15:00 ICICI Securities

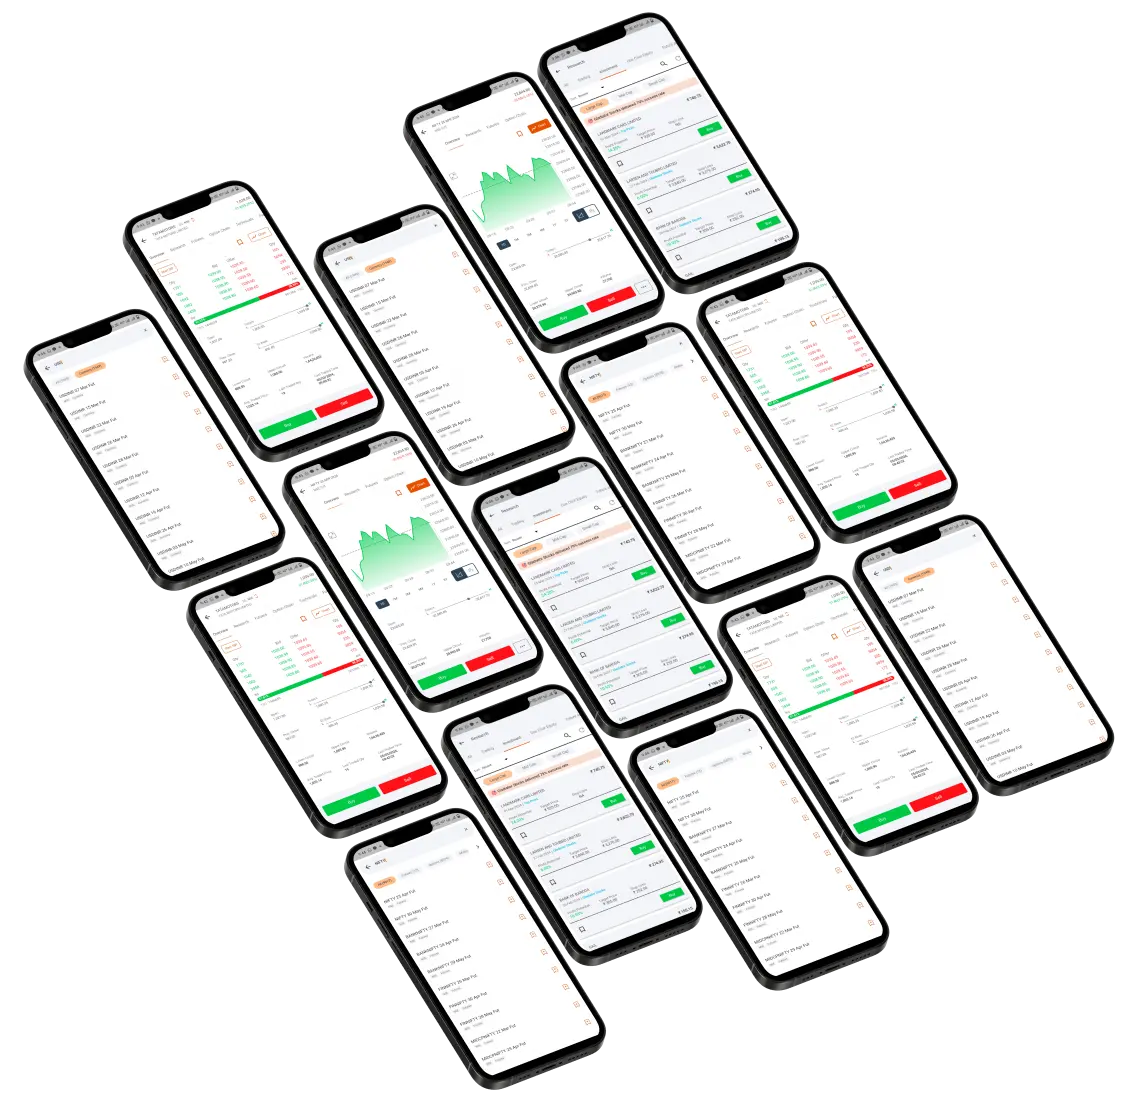
Invest, Track, and Manage your Portfolio Anytime, Anywhere


Invest, Track, and Manage your Portfolio Anytime, Anywhere


ICICI Securities Ltd.( I-Sec). Registered office of I-Sec is at ICICI Securities Ltd. - ICICI Venture House, Appasaheb Marathe Marg, Prabhadevi, Mumbai - 400025, India, CIN: L67120MH1995PLC086241 Tel No:- 022 - 6807 7100. I-Sec is a SEBI registered with SEBI as a Research Analyst vide registration no. INH000000990. Name of the Compliance officer (Research Analyst): Mr.Atul Agrawal , Contact number: 022-40701000, E-mail address: complianceofficer@icicisecurities.com. Investment in securities market are subject to market risks, read all the related documents carefully before investing. The contents herein above shall not be considered as an invitation or persuasion to trade or invest. I-Sec and affiliates accept no liabilities for any loss or damage of any kind arising out of any actions taken in reliance thereon. The information mentioned herein above is only for consumption by the client and such material should not be redistributed.
The information contained herein is strictly confidential and meant solely for the selected recipient and may not be altered in any way, transmitted to, copied or distributed, in part or in whole, to any other person or to the media or reproduced in any form, without prior written consent of ICICI Securities Limited. The contents of this mail are solely for informational purpose and may not be used or considered as an offer document or solicitation of offer to buy or sell or subscribe for securities or other financial instruments or any other product. While due care has been taken in preparing this mail, I-Sec and affiliates accept no liabilities for any loss or damage of any kind arising out of any inaccurate, delayed or incomplete information nor for any actions taken in reliance thereon. This mail is not directed or intended for distribution to, or use by, any person or entity who is a citizen or resident of or located in any locality, state, country or other jurisdiction, where such distribution, publication, availability or use would be contrary to law, regulation or which would subject I-Sec and affiliates to any registration or licensing requirement within such jurisdiction. Registration granted by SEBI and certification from NISM in no way guarantee performance of the intermediary or provide any assurance of returns to investors. None of the research recommendations promise or guarantee any assured, minimum or risk free return to the investors. For any queries or grievances: Mr. Prabodh Avadhoot Email address: headservicequality@icicidirect.com Contact Number: 18601231122
CloseWelcome back! You already have an account with ICICI Direct.
Generate PasswordWelcome back! You already have an account with ICICI Direct.
LoginWelcome back! You already have an account with ICICI Direct.
LoginThese terms and conditions ("WhatsApp Terms and Conditions" as amended from time to time) are applicable to the Customers (defined hereinafter) that avail the Services (defined hereinafter) provided thereon by ICICI Securities Limited ("ICICI Securities") on the WhatsApp platform.
The WhatsApp Terms and Conditions shall be in addition to any other terms and conditions as stipulated by the ICICI Securities from time to time on its website (www.icicidirect.com) whether pertaining to the account or in relation to other products, services or facilities provided by ICICI Securities.
Any services that may be offered to the customer through the WhatsApp platform ("WhatsApp") is at the discretion of the ICICI Securities and/or basis the eligibility criteria of a customer and such services are subject to certain terms and conditions. In case of conflict between any of these WhatsApp Terms and Conditions and the terms and conditions for other services provided on the WhatsApp channel, specific terms and conditions of such services shall prevail.
Further, in case of inconsistency between the WhatsApp Terms and Conditions and any specific terms and conditions pertaining to account or any specific service/product/offer, the specific terms and conditions of that particular service/product/offer shall prevail.
1. DEFINITIONS
"Trading Account" refers to the trading account maintained by the Customer with ICICI Securities.
"Trading Account Related Services" shall mean the Services which pertain to information in relation to the Trading Account maintained with ICICI Securities by customer including but not limited to portfolio valuation, stock quote, order details, trade details etc which are enabled by ICICI Securities, from time to time, at its sole discretion.
"Registered ICICI Securities Number" is the authorized number of ICICI Securities, registered with WhatsApp for the purposes of providing Services herein.
"Customer" shall mean any person holding Trading Account or any prospective customer with ICICI Securities and interacting with ICICI Securities on WhatsApp using the Registered ICICI Securities Number / using the Services provided by ICICI Securities through WhatsApp. "Customer Information" refers to the personal data or information or such other data or information including any sensitive personal data in relation to the Customer such as information in relation to the trading account of the Customer, shared by the Customer or provided to the Customer by ICICI Securities or collected or obtained from the Customer or from WhatsApp or from any such source in the course of the Customer availing the Services hereunder.
"One Way Communication" shall mean the service provided by ICICI Securities to the Customer on WhatsApp where ICICI Securities sends its Customer one-way messages through its Registered ICICI Securities Number in the nature of information, alerts, updates, transaction alerts in relation to the Customer's Trading Account and such other communications as ICICI Securities may enable from time to time, at its discretion.
"Privacy Policy/Privacy Commitment" shall have the meaning as ascribed on the Website; "Service(s)" shall mean the One Way Communication and Two Way Communication services provided by ICICI Securities by itself or through any of its service providers, to a Customer on WhatsApp.
"Two Way Communication" shall mean the service provided by ICICI Securities to the Customers on WhatsApp where the Customer can communicate with ICICI Securities by sending it messages in the form of making requests, seeking information, asking queries etc. on the Registered ICICI Securities Number and where ICICI Securities responds to such messages. However, this service and ICICI Securities responses shall be limited only to such queries, information, requests etc. as may be determined by ICICI Securities from time to time, at its sole discretion.
"WhatsApp" is the application provided by WhatsApp Inc. 1601 Willow Road, Menlo Park, California 94025.
2. INTERPRETATION
3. PURPOSE
This WhatsApp platform serves as a supplementary medium through which we can communicate with you and provide Services and further enable certain services as ICICI Securities may decide in its sole discretion.
4. ELIGIBILITY FOR USING THE SERVICES
The Customer hereby agrees and undertakes that he/she shall use the Services only if he/she fulfills the eligibility as given below:
5. APPLICABILITY OF WHATSAPP TERMS AND CONDITIONS
These WhatsApp Terms and Conditions form a contract between the Customer and ICICI Securities. The Customer shall apply to ICICI Securities in the prescribed manner for availing of the Services. By applying and opting in for the Services, the Customer acknowledges that he has read, understood and accepted these WhatsApp Terms and Conditions and other specific terms and conditions as pertaining to the Account and any other products/offers/facilities and services availed by the Customer whether or not through WhatsApp.
No act, delay or omission by ICICI Securities shall affect its rights, powers and remedies under these Terms and Conditions and other terms on ICICI Securities website (www.icicidirect.com), hereinafter referred to as "Website".
The Customer hereby accepts and agrees that all Services and communications (both One Way Communication and Two Way Communication) taking place on WhatsApp, initiated either by ICICI Securities or the Customer, will be governed by and subject to these WhatsApp Terms and Conditions. Further, the Customer hereby agrees that the Customer grants express authority to ICICI Securities for carrying out the Services requested by the Customer on WhatsApp on its Registered ICICI Securities Number. Provided however that ICICI Securities shall not be required to authenticate the Customer, if any request for the Services comes on WhatsApp to ICICI Securities Registered Number, and in case of a Customer, if the number reflected in the requestor's mobile is a Customer's Registered Number, ICICI Securities shall be entitled to presume that it is the Customer itself which is interacting through WhatsApp and in case of any other Customer ICICI Securities shall be entitled to presume that the number reflected in the WhatsApp profile is the Customer's number and it is the Customer itself and not any other person who is interacting with ICICI Securities Registered Number. ICICI Securities's own record or log of transactions maintained through computer systems or otherwise shall be accepted as conclusive and binding for all purposes.
6. SERVICES
The Customer agrees and accepts that ICICI Securities reserves the right to provide only such Services as ICICI Securities may at its discretion permit from time to time. ICICI Securities may also inform/update the availability/non-availability of any particular Service, at its sole discretion. The Customer hereby agrees that ICICI Securities may at any time, without notice to the Customer, modify, discontinue or make additions/deletions to the Services offered to the Customer. The Customer agrees that he shall not hold ICICI Securities responsible for not responding to the queries of/ information sought by the Customer or not providing a response to the satisfaction of the Customer or not processing any request of the Customer, in case such a message sent by the Customer in case ICICI Securities does not receive an instruction to this effect in its systems or the message sent by the Customer is not in the format as required by ICICI Securities or does not fall under the Services being offered by ICICI Securities at the time or ICICI Securities does not receive such a message for technical reasons or otherwise or for any reason whatsoever. ICICI Securities will have no liability in case of any fraud or impersonation incidents through the WhatsApp platform. Further, in case ICICI Securities permits any Service in the nature of a transaction, the Customer agrees that such a Service shall be subject to statutory/ regulatory limits and/or any limits that may be imposed by ICICI Securities, from time to time, at its sole discretion.
7. REGISTRATION AND VERIFICATION
For availing the One Way Communication and Two Way Communication service, the Customer agrees and confirms to have accepted (a) the WhatsApp Terms and Conditions applicable to the Customer for availing the Services mentioned herein; (b) the Privacy Policy of ICICI Securities applicable to the Customer for availing the Services mentioned herein; (c) any other Account/product/service/offer related specific terms and conditions as applicable and (d) all terms and conditions prescribed by WhatsApp for using its platform.
Provided that, ICICI Securities may modify the process for authentication, registration and/or verification of the Customer, for One Way Communication and/or Two-Way Communication, at any time, at its sole discretion.
8. UNSUBSCRIBE
You may choose/request for de-registration/un-subscription of the Services at any point of time by following the process as may be prescribed by ICICI Securities from time to time. Currently ICICI Securities provides the following channels for un-subscription:
However, the Customer agrees that for this to come into effect, it may take such time as may be required by ICICI Securities. The Customer agrees that he will remain responsible for any requests made/ messages sent to ICICI Securities using the Services prior to the time such cancellation of the Services is effected by ICICI Securities. ICICI Securities will be at liberty to discontinue/ suspend/ terminate the Customer's use of the Services at any time without assigning any reason whatsoever. ICICI Securities may also discontinue or suspend or terminate Services/ facilities without prior notice if these Terms and Conditions are breached.
Once we have received the notification that you have unsubscribed, we will no longer process your information for the purpose(s) you originally agreed to and sent any further notification/message through WhatsApp, unless legally permissible otherwise.
9. IMPORTANT
ICICI Securities shall not be responsible or liable to the Customer or any third party for the consequences arising out of or in connection with using of this Service. The Customer should immediately opt-out of the Services as per the unsubscribe process as detailed in section 8 above.
10. THIRD PARTY
WhatsApp is owned by a third-party unaffiliated with ICICI Securities. The Customer shall independently be guided by the privacy policies of WhatsApp and the third parties or group companies of WhatsApp and ICICI Securities has no control over them. ICICI Securities is not responsible for the privacy or security policies at these sites or other third-party sites that may be linked to within ICICI Securities's social media channels. The Customer should always review the privacy and security practices and policies of each third-party site you visit. ICICI Securities does not endorse and is not responsible for any ads, content, products, advice, opinions, recommendations or other material of third-party sites that may be promoted via advertising within any social media channels.
WhatsApp is owned by a third-party unaffiliated with ICICI Securities. The Customer shall independently be guided by the privacy policies of WhatsApp and the third parties or group companies of WhatsApp and ICICI Securities has no control over them. ICICI Securities is not responsible for the privacy or security policies at these sites or other third-party sites that may be linked to within ICICI Securities's social media channels. The Customer should always review the privacy and security practices and policies of each third-party site you visit. ICICI Securities does not endorse and is not responsible for any ads, content, products, advice, opinions, recommendations or other material of third-party sites that may be promoted via advertising within any social media channels.
The Customer further understands and agree that WhatsApp or any other service provider through which we are providing the WhatsApp facility can review and monitor, store the contents shared/communicated through the WhatsApp or other service provider(s) and may share the same with third parties.
Hence, we strongly recommend that you:
11. DISCLAIMER OF LIABILITY
ICICI Securities shall not be responsible for any failure on the part of the Customer to utilize the WhatsApp facility due to the Customer not being within the geographical range within which the WhatsApp facility is offered and which forms part of the roaming network of such cellular service provider, providing services to the Customer availing such roaming facility from the respective cellular service provider. If the customer has reason to believe that the mobile phone number is / has been allotted to another person and / or there has been an unauthorized transaction in the account and / or his mobile phone handset is lost, he shall immediately inform ICICI Securities of the same.
The Customer agrees that ICICI Securities shall not be liable if:
ICICI Securities shall endeavor to provide the WhatsApp facility on a best effort basis and the Customer shall not hold ICICI Securities liable for non-availability of the WhatsApp facility or non-performance by service providers, if any, engaged by ICICI Securities or any loss or damage caused to the Customer as a result of use of the WhatsApp facility for causes which are not attributable to ICICI Securities. ICICI Securities shall not be liable in any manner to the Customer in connection with the use of the WhatsApp facility.
ICICI Securities shall endeavor to carry out the instructions received from the Customer through the WhatsApp channel promptly, provided that ICICI Securities, shall not be responsible for the delay in carrying out such instructions due to any reason whatsoever, including, but not limited to, failure of operational system or any requirement of law or ICICI Securities's internal policies.
The Customer accepts that each WhatsApp communication may contain certain account information relating to the Customer. The Customer authorizes ICICI Securities to send account related information, though not specifically requested, if ICICI Securities deems that the same is relevant.
ICICI Securities shall not be held responsible for the confidentiality, secrecy and security of the personal or account information being sent through the WhatsApp facility. The Customer agrees that the access to the WhatsApp facility shall be only through the Registered Customer Number and any transaction which originates from the same, whether initiated by the Customer or not, shall be deemed to have originated from the Customer.
Under no circumstance, ICICI Securities shall be held liable if the WhatsApp facility is not available for reasons including but not limited to natural calamities, epidemic/pandemic, legal restraints, faults in the telecommunication network or network failure, or any other reason beyond the control of ICICI Securities. ICICI Securities shall not be liable under any circumstances for any damages whatsoever whether such damages are direct, indirect, incidental consequential and irrespective of whether any claim is based on loss of revenue, interruption of business or any loss of any character or nature whatsoever and whether sustained by the Customer or by any other person. Illegal or improper use of the WhatsApp facility shall render the customer liable for payment of financial charges as decided by ICICI Securities or will result in suspension of the WhatsApp facility for the Customer.
ICICI Securities is in no way liable for any error or omission in the services provided by any cellular or any third party service provider (whether appointed by ICICI Securities in that behalf or otherwise) to the Customer, which may affect the WhatsApp facility.
ICICI Securities, does not warrant the confidentiality or security of the messages whether personal or otherwise transmitted through the WhatsApp facility. ICICI Securities makes no warranty or representation of any kind in relation to the system and the network or their function or performance or for any loss or damage whenever and howsoever suffered or incurred by the Customer or by any person resulting from or in connection with the WhatsApp facility.
Without limitation to the other provisions of these WhatsApp Terms and Conditions, ICICI Securities, its employees, agent or contractors, shall not be liable for and in respect of any loss or damage whether direct, indirect or consequential, including but not limited to loss of revenue, profit, business, contracts, anticipated savings or goodwill, loss of use or value of any equipment including software, whether foreseeable or not, suffered by the Customer or any person howsoever arising from or relating to any delay, interruption, suspension, resolution or error of ICICI Securities in receiving and processing the request and in formulating and returning responses or any failure, delay, interruption, suspension, restriction, or error in transmission of any information or message to and from the telecommunication equipment of the Customer and the network of any cellular service provider and ICICI Securities's system or any breakdown, interruption, suspension or failure of the telecommunication equipment of the Customer, ICICI Securities's system or the network of any cellular service provider and/or any third party who provides such services as is necessary to provide the WhatsApp.
Notwithstanding anything in the contrary provided in this terms and conditions, ICICI Securities shall not be involved in or in any way liable to the Customer for any dispute between the Customer and a cellular service provider or any third party service provider or WhatsApp (whether appointed by ICICI Securities for such purpose or otherwise) while availing these Services through the WhatsApp platform.
The Customer shall not interfere with or misuse in any manner whatsoever the WhatsApp facility and in the event of any damage due to improper or fraudulent use by the Customer, the Customer shall be liable for damages to ICICI Securities or for any losses suffered by ICICI Securities.
The Customer is solely responsible for protecting his/her OTP/debit card PIN/ password or mobile phone number and any other password and/or any other mode of verification as prescribed/ issued by ICICI Securities for the use of the WhatsApp facility from time to time without any liability of ICICI Securities in this regard. The Customer hereby agrees and accepts that he/she shall at all times be solely responsible for the protection and safe keep of his/her SIM card, Device and the applications installed thereon, specifically WhatsApp, login IDs, Customer Information, security details and passwords as mentioned hereinabove and hereby fully agrees that ICICI Securities shall in no manner be liable for any direct or indirect or consequential or other loss arising out of any action or omission because of compromise of the same in any manner whatsoever.
The Customer agrees that ICICI Securities assumes no liability whatsoever in case of any event of such compromise of the Customer's WhatsApp and ICICI Securities shall not be held responsible for any such event. Further, the Customer agrees and understands that WhatsApp can also be logged on from more than one device at the same time, including by using web log in and the Customer is aware of the risk in this regard while availing the Services such as compromise of Customer Information, breach of security of the Customer's WhatsApp account from a device other than the Customers and the Customer undertakes to be vigilant and careful and takes full responsibility for the security of his/her WhatsApp account. ICICI Securities shall not be responsible or liable to you or any third party for the consequences arising out of or in connection with using of this Service.
ICICI Securities will not be liable for:
ICICI Securities makes no representation or gives no warranty with respect to the quality of the service provided by any cellular service provider or by WhatsApp or any other service provider enabling ICICI Securities to deliver services through WhatsApp to the Customers.
ICICI Securities may provide any other services as a part of the WhatsApp facility and ICICI Securities shall not be liable for the oversight on part of the Customer to update himself /herself with the addition of services which have been included in the WhatsApp facility.
12. INDEMNITY
In consideration of ICICI Securities providing the WhatsApp facility, the Customer, at his own expense, agrees to indemnify, defend and hold harmless, ICICI Securities, its directors and employees, representatives, agents, customers and/or the affiliates, as the case may be, against all losses, damages, expenses, actions, claims, demands and proceedings whatsoever, that ICICI Securities may incur, sustain, suffer or be put to at any time as a consequence of acting on or omitting or refusing to act on any instructions given by the Customer or otherwise for use of the WhatsApp facility.
The Customer further specifically agrees to indemnify, defend and hold harmless, ICICI Securities and/or its affiliates from any losses occurring as a result of the:
13. TERMINATION
ICICI Securities may, at its discretion, withdraw temporarily or terminate the WhatsApp facility, either wholly or in part, at any time without giving prior notice to the Customer. ICICI Securities may, without prior notice, suspend the WhatsApp facility at any time during which any maintenance work or repair is required to be carried out or in case of any emergency or for security reasons, which require the suspension of the WhatsApp facility.
ICICI Securities may suspend or terminate WhatsApp facility without prior notice if the Customer has breached these WhatsApp Terms and Conditions or ICICI Securities learns of the death, bankruptcy.
14. PROPRIETARY RIGHTS
The Customer acknowledges that the software/ other internet related software which are required for providing the Services or any Intellectual Property Rights of ICICI Securities in the process are the legal property of ICICI Securities/ respective service providers. The permission given by ICICI Securities to avail of the Services to the Customer will/ does not create or convey any rights, title or interest to the Customer or to any person, in the above software or Intellectual Property Rights of ICICI Securities. The Customer agrees that he shall not attempt to modify, translate, disassemble, decompile or reverse engineer such software or create any derivative product based on the software.
15. DISCLOSURE
The Customer hereby expressly authorize and give consent to ICICI Securities to share, exchange, disclose, transfer or part with any of Trading Account information or personal data, contained provided to/ available with ICICI Securities, when ICICI Securities considers such disclosure as necessary or expedient, with:
For the purpose: -
16. GOVERNING LAW
These WhatsApp terms and conditions shall be governed by laws of India. Any dispute or differences arising out of or in connection with the WhatsApp facility shall be subject to the exclusive jurisdiction of the Courts of Mumbai. ICICI Securities accepts no liability whatsoever, direct or indirect for noncompliance with the laws of any country other than that of India. The mere fact that the WhatsApp facility can be accessed by a Customer in a country other than India does not imply that the laws of the said country govern these terms and conditions and / or the operations in the account/s/services/offers provided to the customer and / or the use of the WhatsApp facility.
DISCLAIMER:
I accept the terms and conditions and I have read the privacy policy.
I hereby understand and agree to authorize the ICICI Securities and its affiliates/ group companies to reach me/send any communication pertaining to my Account / Investments and related services/facilities/special offers, or any other relationship held by me with ICICI Securities or in relation to various products, offers and services provided by ICICI Securities /its group companies, through registered e-mail, phone, SMS or any other electronic mode or other messaging or social media platforms. ICICI Securities will be sending One Time Pin (OTP) on the registered mobile number. I understand and agree that the email provider or any other service provider can review/monitor the contents shared/communicated through email provider or other service provider. I understand that such electronic mode of communication(s) are subject to the terms and conditions of the respective service provider and agree to comply with the terms of use of email, SMS, or any other electronic mode, as applicable and updated/modified by the service provider from time to time. I hereby expressly authorize ICICI Securities to disclose, transfer or part with any of my information (including my sensitive personal information, location etc.) or any other device information when ICICI Securities considers such disclosure as necessary, with Agents of ICICI Securities in any jurisdiction; (ii) Auditors, credit rating agencies/credit bureaus (including but not limited to CIBIL), statutory/regulatory authorities, governmental/administrative authorities, Central Know Your Customer (C-KYC) registry , exchanges or SEBI Know Your Client registration agency, having jurisdiction over ICICI Securities; (iii)Service providers, professional advisors, consultants or such person with whom ICICI Securities contracts or proposes to contract.
