
Learning Modules Hide
Hide
- Chapter 1: Power of Combined Technical Indicators – Part 1
- Chapter 2: Power of Combined Technical Indicators – Part 2
- Chapter 3: Directional Movement System
- Chapter 4: Rate of Change Indicator (ROC)
- Chapter 5: Comparative Relative Strength Indicator
- Chapter 6: Types of Market Days – Part 1
- Chapter 7: Types of Market Days – Part 2
- Chapter 8: Pivot Points - Part 1
- Chapter 9: Pivot Points – Part 2
- Chapter 10: Value Area Trading – Part 1
- Chapter 11: Value Area Trading – Part 2
- Chapter 1: Introduction to Technical Analysis
- Chapter 2: Introduction to Charts and Chart Types
- Chapter 3: Trends, Support, and Resistances
- Chapter 4: Breakouts, Stops and Reversals
- Chapter 5: Fibonacci Retracements
- Chapter 6: Candlestick Patterns - One and Two Candle Patterns
- Chapter 7: Candlestick Patterns: Three Candle Patterns
- Chapter 8: Chart Patterns
- Chapter 9: Moving Averages and Crossovers
- Chapter 10: Price Volume Confirmation
- Chapter 11: Technical Indicators - Part 1: MACD and Stochastics
- Chapter 12: Technical Indicators - Part 2: Bollinger Bands and Relative Strength Index (RSI)
- Chapter 13: Do’s and Don’ts for Effective Trading Using Technical Analysis
Chapter 6: Candlestick Patterns - One and Two Candle Patterns
How often do you come across a situation where you work very hard to understand markets and create strategies but are unable to make profits consistently? Do you spend hours understanding price movements and still need to witness trading success? Chances could be high that you are using the wrong charts to understand price movements. An introduction to candlestick charts and the ensuing chart patterns will help you make better-informed trading decisions.
Japanese candlesticks provide a more clear visual perspective for projecting upcoming market activity. Intraday charts with clear candle patterns help in framing entry and exit strategies. We did look at the meaning and interpretation of candlestick charts in the earlier chapters. Providing a quick recap here, A candlestick offers a visual representation of price movement. They are widely used as they allow you to quickly and accurately understand the price information. There can be one, two, and multiple candle patterns.
One candle patterns
As the name suggests, a single candle pattern is formed by a single candle. This single candle will represent one trading session, so no signal is generated based on this single candle. These candles can be exceptionally profitable, provided you can identify and set up trades on time. You also need to pay attention to the length of the candle. The longer the candle, the more intense the trading activity and vice versa. Let us look at some critical one-candle patterns.
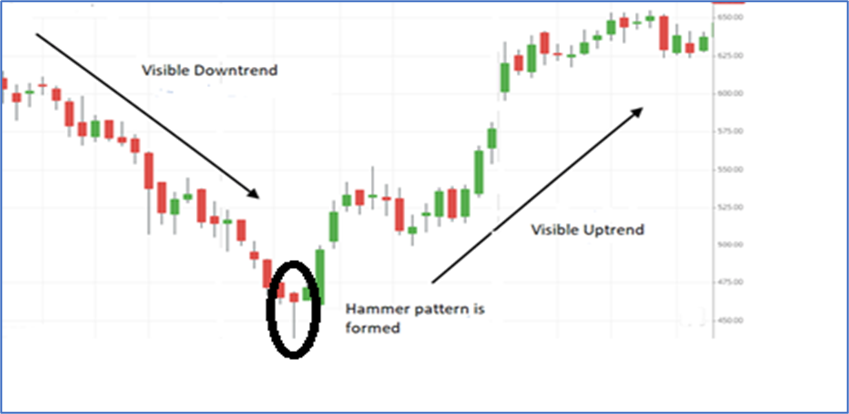
Hammer
A hammer pattern is typically seen in a downtrend. It is a type of bullish reversal pattern. The name is such because the candle looks like a hammer. This candle has a long lower wick and a short body. This candle also has little to no upper wick. You can validate the hammer pattern if the lower wick is two times longer than the candle's body. Also, ensure that the candle's body is at the upper end of the trading range. A hammer pattern in a downtrend signals a potential reversal. This represents a trading period where the sellers were in control, but the buyers successfully reversed the power and drove the prices back to the near high of the day. Upon seeing this, most traders wait for the next trading day to open higher than the previous day's close.
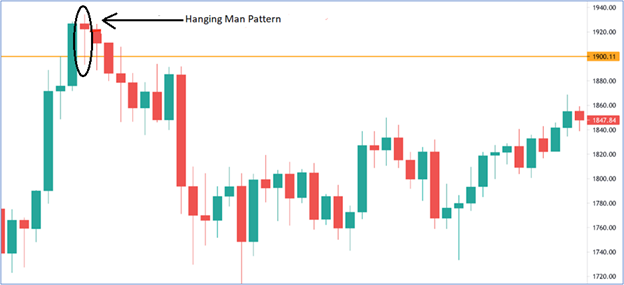
Hanging Man
The Hanging Man pattern is a classic example of a bearish reversal pattern. This pattern forms at the top of an uptrend. A small real body characterizes it at the top of the trading range, and a long lower shadow or wick suggests that the price was pushed down during the session, but buyers managed to bring the price back up. This pattern indicates that the bulls are losing their grip on the market and that a trend reversal may be imminent.
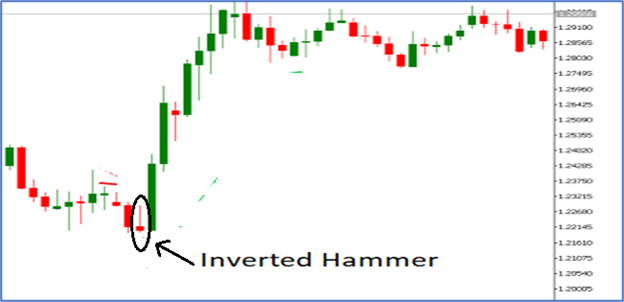
Inverted Hammer
The Inverted Hammer pattern is a bullish reversal pattern that forms at the bottom of a downtrend. It is similar in appearance to the Hanging Man pattern but appears at the bottom of the trend instead of the top. It is characterized by a small real body at the bottom of the trading range and a long upper shadow or wick, which suggests that the price was pushed up during the session, but sellers managed to bring the price back down. This pattern indicates that the bears are losing their grip on the market and that a trend reversal may be imminent.
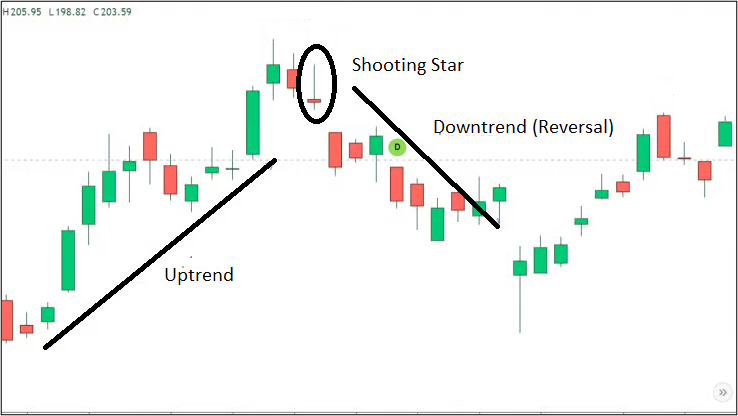
Shooting Star
The Shooting Star pattern is a bearish reversal pattern typically forming at the top of an uptrend. A small real body characterizes it at the top of the trading range and a long upper shadow or wick, which suggests that the price was pushed up during the session, but sellers managed to bring the price back down. This pattern indicates that the bulls are losing their grip on the market and that a trend reversal may be imminent. Check the following chart.
Two candle patterns
We looked at some single candle patterns. However, some patterns develop over two or three trading sessions. Several patterns evolve over two trading sessions. To understand them, you need to look at two candles. Let us know some two candle chart patterns.
Bullish and Bearish Engulfing
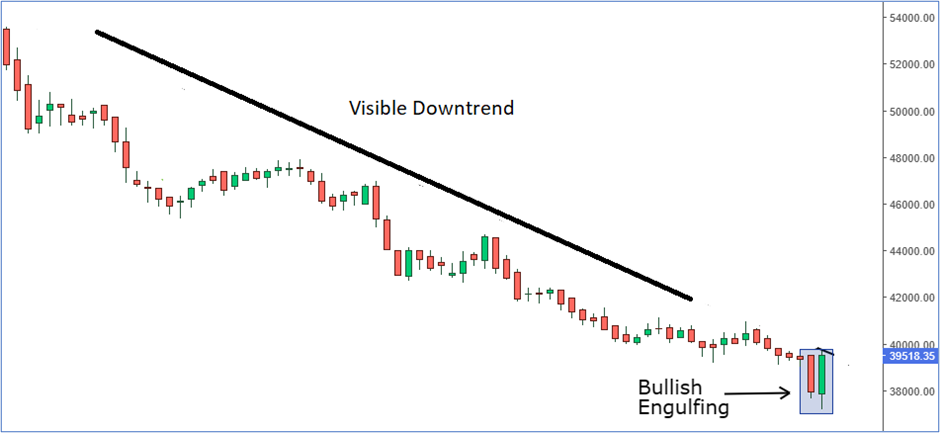
An engulfing pattern emerges over two trading sessions. The first candle (the candle on the previous day) is usually a tiny candle in appearance. The second candle (the candle on the following day) is much larger, and it appears as if the second candle will consume or engulf the first one. If this pattern is seen at the bottom of the trend, it is called bullish engulfing, signaling a bullish reversal. The first candle is a short red candle indicating bearishness. The candle formed the next day is a longer bullish candle indicating a trend reversal.
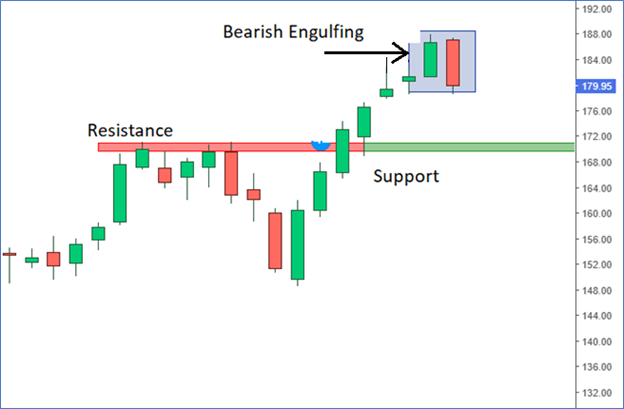
If the same pattern is observed on the top of the trend is called bearish engulfing, indicating bearishness. The first candle is a short bullish candle followed by a longer dark bearish candle. The thought process is very similar to the bullish engulfing.
Bullish and Bearish Harami
Harami patterns are reversal patterns indicating a shift in the existing trend.
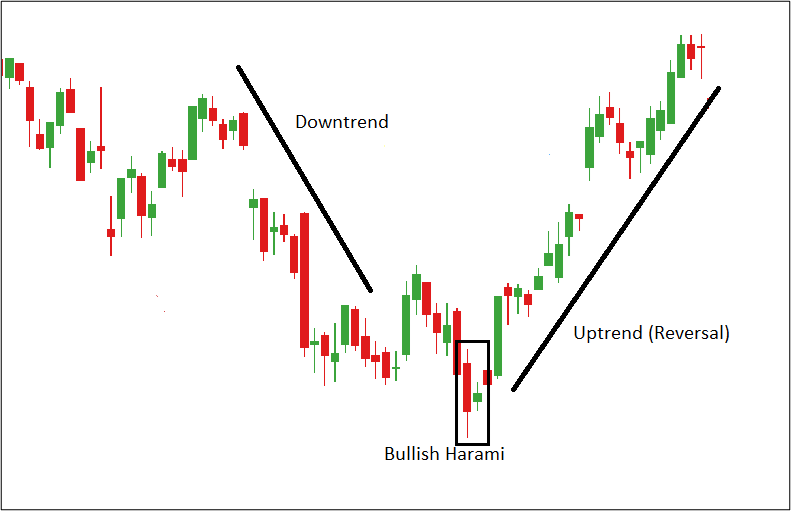
Both Harami and engulfing patterns help in effectively identifying reversals. You should also note that the two candles under consideration under the Harami pattern can be of the same color. A bullish Harami pattern appears at the bottom of the trend and is formed when a large bearish/dark candle appears on day 1, and it is followed by a smaller bullish candle formed on day 2. The smaller candle should fit within the larger candle created the previous day. You should note that there has to be a gap up in prices on day 2. This is because buyers will not allow the price to fall closer to the closing of day 1.
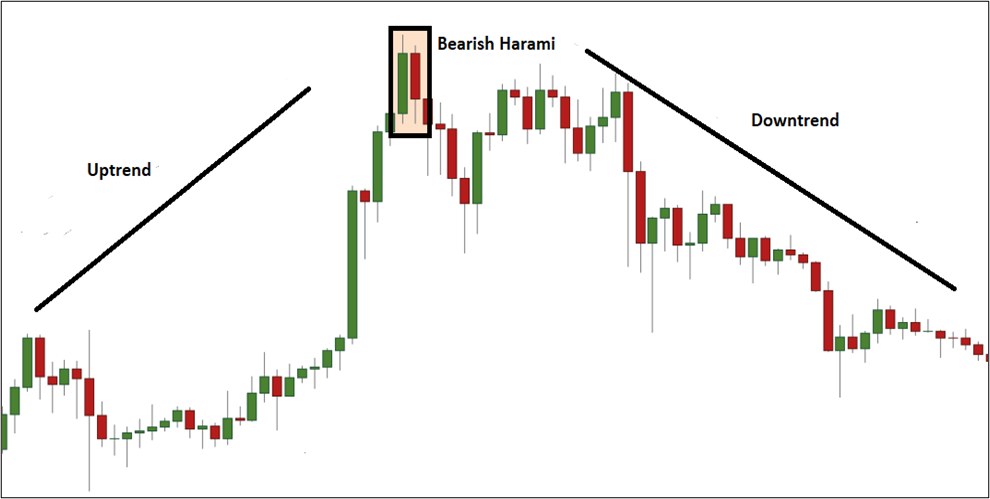
A bearish Harami pattern forms at the top of the trend, where you can see a longer bullish candle on day 1 followed by a smaller dark/bearish candle on day 2. You should also note that prices should gap down. This indicates that more selling pressure will not allow the price to go near the previous day's closing price.
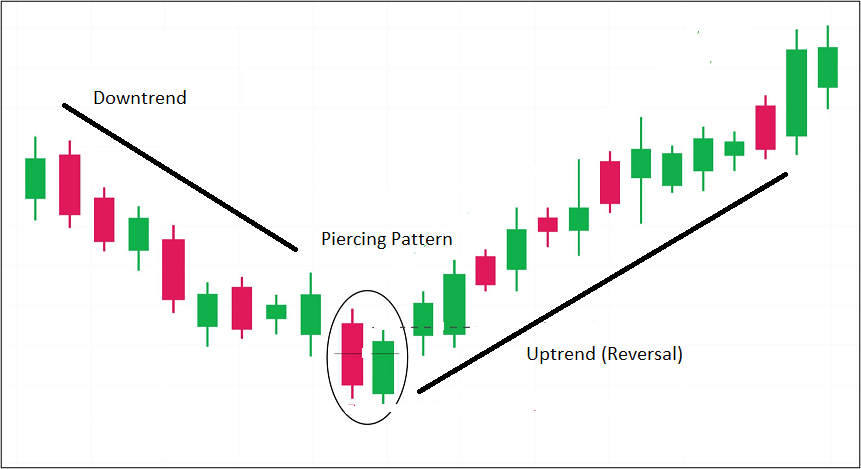
Piercing Pattern
A piercing pattern consists of two candlesticks where the first candlestick will be a dark/bearish candle having a large real body. The second candle will be bullish. You should also note that the second candle usually open below the opening of the previous candle. The second candlestick should close above the middle of the real body of the previous day's candle. It signifies a potential reversal from a downtrend to an upward trend. It signals potential bullishness.
In the above candle patterns, you have come across the term ‘gap up and gap down.’ Let us quickly understand the meaning of these terms here. However, we will cover these in detail in the next chapter. Gap (up and down) is a common price behavior that happens when the stock's opening price on a certain day has a vast difference from the stock's closing price on the previous day.
Now that we have learned some of the basic one and two-candle patterns let us quickly summarize the key takeaways from this chapter.
Summary
- A hammer pattern is typically seen in a downtrend. It is a type of bullish reversal pattern. This candle has a long lower wick and a short body. This candle also has little to no upper wick. You can validate the hammer pattern if the lower wick is two times longer than the candle's body.
- A hanging man pattern is found in an uptrend and is a bearish reversal pattern. This candle has a long lower wick and a short body with little to no upper wick.
- Both Harami and Engulfing are reversal patterns. A bearish Harami pattern forms at the top of the trend, where you can see a longer bullish candle on day 1 followed by a smaller dark/bearish candle on day 2. A bullish Harami, on the other hand, is formed at the bottom of the trend. A long bearish candle is seen on day 1, followed by a smaller light / bullish candle on day 2.
- In a bullish engulfing pattern, the first candle is a short red candle indicating bearishness. The candle formed the next day is a longer bullish candle indicating a trend reversal. In a bearish engulfing pattern, the first candle is a short bullish candle followed by a longer dark bearish candle.
- A piercing pattern consists of two candlesticks where the first candlestick will be a dark/bearish candle having a large real body. The second candle will be bullish.
In the next chapter, we shall look at a few interesting three-candle patterns, like the morning and evening stars. In the upcoming chapter, we will also understand concepts like ‘Gaps’ and ‘Doji.’


Please Enter Email


COMMENT (0)