
Learning Modules Hide
Hide
- Chapter 1: Power of Combined Technical Indicators – Part 1
- Chapter 2: Power of Combined Technical Indicators – Part 2
- Chapter 3: Directional Movement System
- Chapter 4: Rate of Change Indicator (ROC)
- Chapter 5: Comparative Relative Strength Indicator
- Chapter 6: Types of Market Days – Part 1
- Chapter 7: Types of Market Days – Part 2
- Chapter 8: Pivot Points - Part 1
- Chapter 9: Pivot Points – Part 2
- Chapter 10: Value Area Trading – Part 1
- Chapter 11: Value Area Trading – Part 2
- Chapter 1: Introduction to Technical Analysis
- Chapter 2: Introduction to Charts and Chart Types
- Chapter 3: Trends, Support, and Resistances
- Chapter 4: Breakouts, Stops and Reversals
- Chapter 5: Fibonacci Retracements
- Chapter 6: Candlestick Patterns - One and Two Candle Patterns
- Chapter 7: Candlestick Patterns: Three Candle Patterns
- Chapter 8: Chart Patterns
- Chapter 9: Moving Averages and Crossovers
- Chapter 10: Price Volume Confirmation
- Chapter 11: Technical Indicators - Part 1: MACD and Stochastics
- Chapter 12: Technical Indicators - Part 2: Bollinger Bands and Relative Strength Index (RSI)
- Chapter 13: Do’s and Don’ts for Effective Trading Using Technical Analysis
Chapter 10: Price Volume Confirmation
Most new traders are disturbed by occurrences of volatility in the markets. Too much volatility causes jitters, and new traders panic and lose a lot of money. This deters them from participating further in trading. At some point in time, you may have also encountered this. You need to understand that too much activity in the market causes volatility and big moves. All the chart patterns and data points like price, trends, and indicators tell a story. Price movements and volume analysis also tell a story that helps you understand their relationship.
Price and volume
Price and volume analysis is an important aspect of technical analysis used by traders to better understand an asset’s price and volume movement. It involves analyzing an asset’s price action and volume over a set period, typically a certain number of days or weeks. Price and volume analysis aims to help traders identify trends and make informed trading decisions.
Let us quickly understand price analysis’s role in the overall scheme of things.
Price analysis
Price analysis plays a crucial role in technical analysis as it focuses on market analysis. Technical analysts use charts and other tools to analyze historical price data to identify patterns and trends. These in turn can help predict future price movements. Price analysis involves the examination of various aspects of the price of a security, such as its price level, trend, volatility, and momentum. Technical analysts use various price indicators and chart patterns to identify buying and selling opportunities based on the price movements of a security.
Price analysis can also help technical analysts to identify potential support and resistance levels, which are price levels where buying or selling pressure may increase, leading to price reversals. By identifying these levels, technical analysts can make better decisions about entering and exiting trades. Overall, price analysis is an essential component of technical analysis and plays a significant role in helping traders and investors to make informed decisions about buying and selling securities in financial markets.
Let us also understand volume and its role in technical Analysis.
Volume
Look at the following chart:
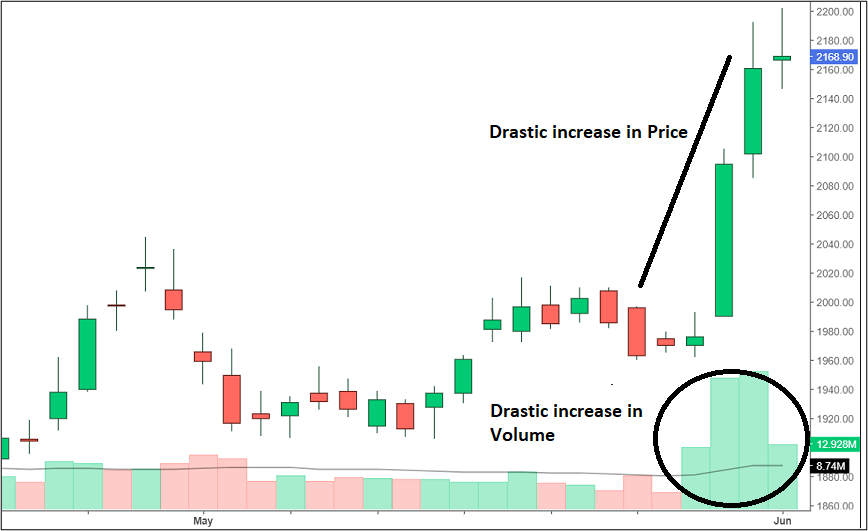
In the above chart, you can observe a sudden spike in the price of the security accompanied by a sudden spike in volume. But, before we analyze this unique relationship between the price and volume, let us familiarize ourselves with this concept of volume.
Volume refers to the number of shares traded in a specific security or market during a certain time period, such as a day or week. Volume is an important indicator of market activity and can provide valuable insights into price trends and momentum. Volume is typically plotted on a chart alongside price data, allowing technical analysts to observe the relationship between the two variables. When a security experiences a high volume of trading activity, it can indicate increased buying or selling pressure, which can have an impact on the price.
Observe the following chart. It shows that a spike in the volume can cause the price to either go up or fall systematically.
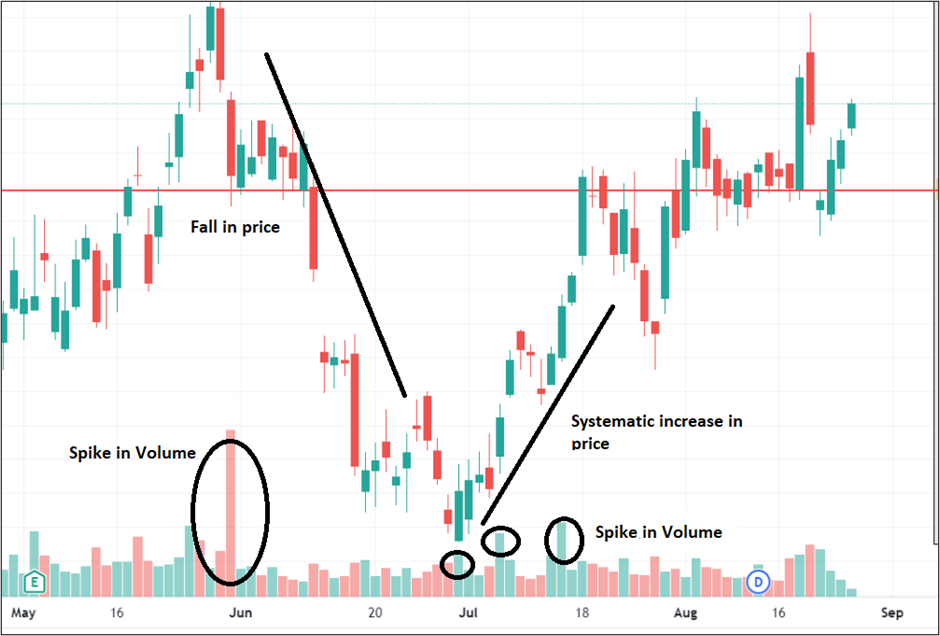
For example, let's say that a particular stock has been trading at a relatively low volume for an extended period of time. Suddenly, there is a spike in volume, with several million shares being traded in a single day. This high volume may indicate that there is significant interest in the stock, with investors either buying or selling in large quantities.
If the stock price also rises on the day of high volume, it could suggest that buying pressure pushes the price up. Conversely, if the stock price falls on the day of high volume, it could indicate that there is selling pressure driving the price down.
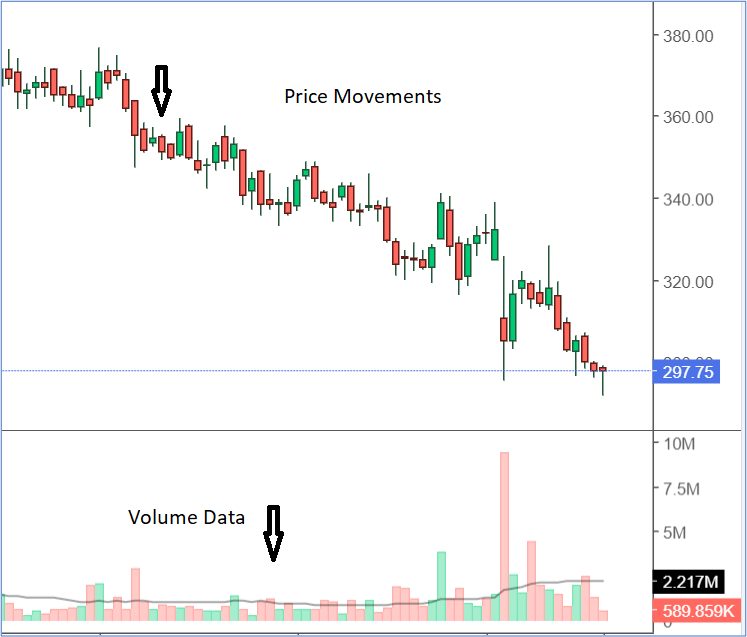
Volume can also be used to confirm or refute technical indicators. Suppose technical indicators suggest that a stock is likely to rise. In that case, a high trading volume can confirm this upward trend. However, if the price rises without a corresponding increase in volume, it may not be sustainable, and a correction could be on the horizon. Overall, volume plays a critical role in technical analysis, providing traders and investors with valuable insights into market activity and helping to confirm or refute technical indicators. The candlesticks represent price and the vertical bars below represents volume. You can clearly see in the chart that price has a certain correlation with the volume.
Price action and its benefits
Price action refers to the movement of an asset’s price over a set period of time. Most technical analysis tools and chart patterns are derived from price action analysis. The goal of price action analysis is to identify trends and make informed trading decisions based on the asset’s price movement.
Price action analysis has several benefits, including:
- It is simple to understand and use, making it accessible to traders of all levels of experience.
- It is based on real-time data, providing traders with a more accurate representation of the current market.
- A lot of individuals utilize price information to create technical indicators. By implementing trendlines on the price chart, it is possible to establish patterns for technical analysis.
Summary
- Price and volume analysis is an important aspect of technical analysis used by traders to gain a deeper understanding of an asset’s price and volume movement.
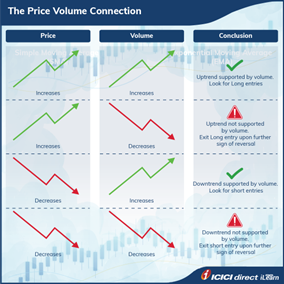
- Using volume can help confirm the price trend. If there is not enough volume to support the trend, it is likely that the trend will not last.
- The relationship between price and volume is one of the most important aspects of price and volume analysis. Price action analysis is a simple and effective way to identify trends and make informed trading decisions.
In the next chapter, we shall be looking into indicators like MACD and Stochastics.


Please Enter Email


COMMENT (0)