
Learning Modules Hide
Hide
- Chapter 1: Power of Combined Technical Indicators – Part 1
- Chapter 2: Power of Combined Technical Indicators – Part 2
- Chapter 3: Directional Movement System
- Chapter 4: Rate of Change Indicator (ROC)
- Chapter 5: Comparative Relative Strength Indicator
- Chapter 6: Types of Market Days – Part 1
- Chapter 7: Types of Market Days – Part 2
- Chapter 8: Pivot Points - Part 1
- Chapter 9: Pivot Points – Part 2
- Chapter 10: Value Area Trading – Part 1
- Chapter 11: Value Area Trading – Part 2
- Chapter 1: Introduction to Technical Analysis
- Chapter 2: Introduction to Charts and Chart Types
- Chapter 3: Trends, Support, and Resistances
- Chapter 4: Breakouts, Stops and Reversals
- Chapter 5: Fibonacci Retracements
- Chapter 6: Candlestick Patterns - One and Two Candle Patterns
- Chapter 7: Candlestick Patterns: Three Candle Patterns
- Chapter 8: Chart Patterns
- Chapter 9: Moving Averages and Crossovers
- Chapter 10: Price Volume Confirmation
- Chapter 11: Technical Indicators - Part 1: MACD and Stochastics
- Chapter 12: Technical Indicators - Part 2: Bollinger Bands and Relative Strength Index (RSI)
- Chapter 13: Do’s and Don’ts for Effective Trading Using Technical Analysis
Chapter 11: Technical Indicators - Part 1: MACD and Stochastics
Let’s say you are driving down the highway on a foggy morning. The vehicle ahead of you will probably have its blinkers and hazard lights on. You will also do the same to help the vehicles behind you. In technical analysis, we also have these indicators, which perform similar functions. Technical indicators are mathematical patterns that can be derived from historical price data. These indicators will help you to forecast the price better. It helps you gain a sense of direction and clear signals in which prices are expected to move.
Moving Average Convergence Divergence (MACD)
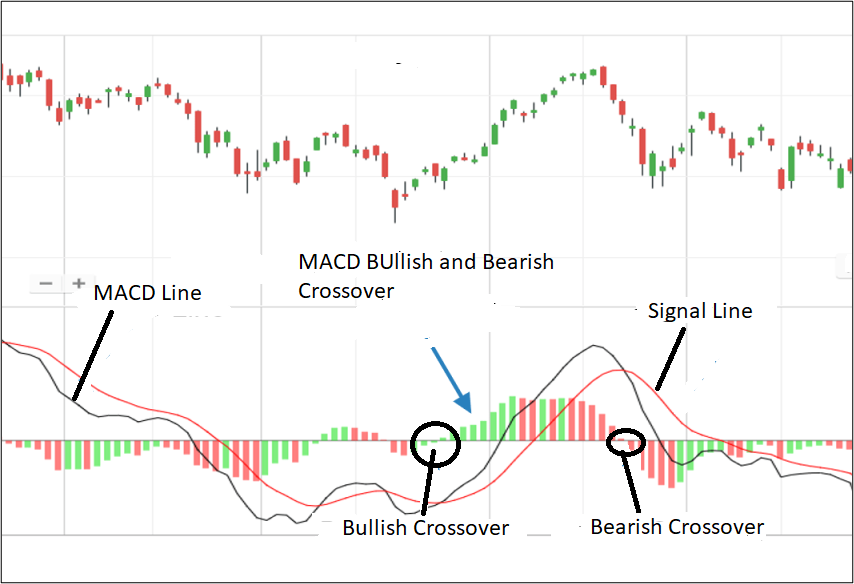
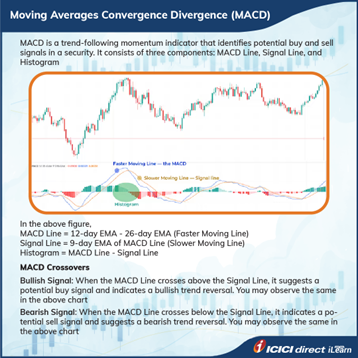
This is a hugely popular technical indicator that shows relationship between two EMAs (Exponential moving averages). (Note: We discussed EMA in the earlier chapters). Traders use MACD to identify trend changes, momentum, and potential buying and selling opportunities. It is calculated using two exponential moving averages (EMAs) of different lengths. Typically, 12 and 26 periods and a signal line, which is a 9-period EMA of the MACD line, are considered for calculating MACD. The signal line in MACD is a moving average of the MACD line itself. The signal line can help traders identify potential buy or sell signals.
We calculate the MACD line by subtracting the 26-period EMA from the 12-period EMA. The signal line is then calculated as a 9-period EMA of the MACD line. Before we interpret the observations, let us also look at the meanings of the term ‘convergence’ and ‘divergence’. Convergence occurs when the MACD line and the signal line move closer together. This suggests that the momentum of the trend is weakening and that there may be a potential change in direction. This is generally considered as a bearish signal.
On the other hand, divergence occurs when the MACD line and the signal line move further apart. This suggests that the momentum of the trend is increasing and that there may be a potential continuation of the current trend. This is generally seen as a bullish signal.
When the MACD line crosses above the signal line, it is interpreted as bullish, indicating a potential trend reversal or buying opportunity. Conversely, when the MACD line crosses below the signal line, it is seen as a bearish signal, indicating a potential trend reversal or a selling opportunity.
Traders and investors often use the MACD in conjunction with other technical indicators and chart patterns to confirm or refute signals. For example, if the MACD line crosses above the signal line, and the price is also above a key support level, this could be seen as a stronger bullish signal.
Look at the following chart to understand this better.
Overall, the MACD is a versatile and widely used technical indicator that can provide valuable insights into market trends and potential buying and selling opportunities. However, like all technical indicators, the MACD is not foolproof and should be used along with other tools and analysis techniques to make informed trading decisions.
Did you know?
A technical indicator is a graphical display of mathematical calculations and is compared to the corresponding price chart for analysis. The mechanics of a technical indicator typically capture not only the behavior but also the psychology of investors.
Stochastics
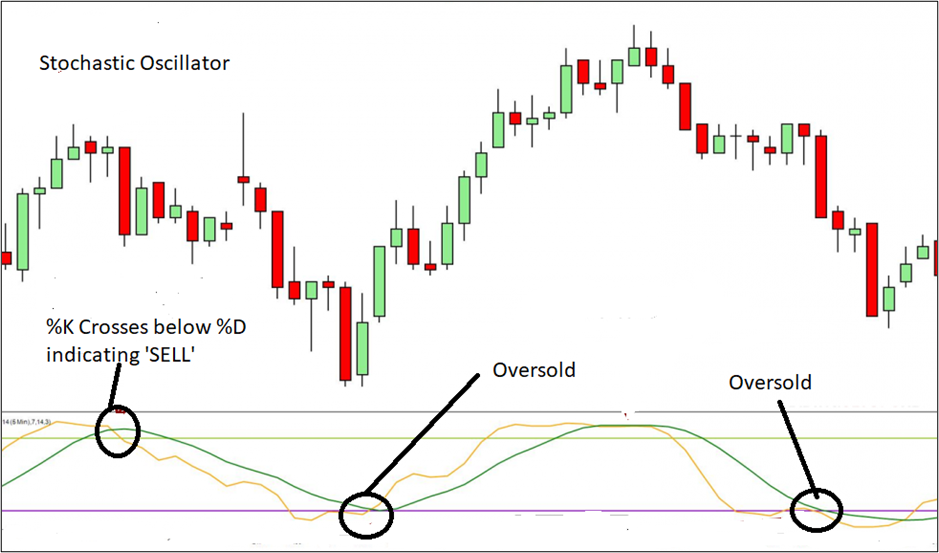
Stochastics is a popular technical indicator used in financial markets to identify overbought and oversold conditions and potential trend reversals. The Stochastic Oscillator is calculated based on the relative position of the current closing price to the price range over a specified period, typically 14 periods.
The Stochastic Oscillator consists of two lines, the %K line and the %D line. The %K line is the main / primary line and depicts the current position of the closing price relative to the high-low range over the specified period. This %K line can be used to identify oversold regions at 20% - 30% and overbought regions at 70% -80%. The %D line is a moving average of the %K line and is typically calculated as a 3-period moving average.
As mentioned earlier, Stochastic Oscillator oscillates between 0 and 100 and is plotted on a chart. Readings above 80 are considered overbought, indicating that the security may be due for a price correction or reversal. Conversely, readings below 20 are considered oversold, indicating that the security may be due for a price bounce or reversal. Check the following image to understand Stochastics better.
Traders and investors often use the Stochastic Oscillator in conjunction with other technical indicators and chart patterns to confirm or refute signals. For example, if the Stochastic Oscillator indicates an oversold condition, and the price is also near a key support level, this could be seen as a stronger bullish signal.
The Stochastic Oscillator is a versatile and widely used technical indicator that can provide valuable insights into market trends and potential buying and selling opportunities. However, like all technical indicators, the Stochastic Oscillator is not infallible and should be used with other tools and analysis techniques to make informed trading decisions.
Histogram
In technical analysis, a histogram is a charting tool used to represent the difference between two variables, such as the price of a security and a technical indicator. Histograms are commonly used to display the difference between two moving averages, as in the MACD indicator.
The histogram is plotted as a bar chart, with bars above the zero line representing bullish momentum and bars below the zero line (the black line separating the histogram into two) representing bearish momentum. The height of each bar represents the difference between the two variables being compared. The histogram indicator consists of vertical bars or rectangles that are positioned above or below a zero line, with varying heights. The bars represent the strength and momentum of price movements. When the histogram bars are above the zero line, it indicates bullish momentum, suggesting that buyers are in control. Conversely, when the bars are below the zero line, it indicates bearish momentum, suggesting that sellers are in control. The same can be seen in the following image.
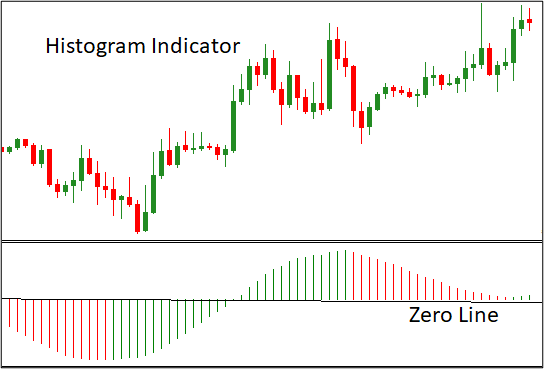
Observe the above image. In the case of a new trend, a buy signal is generated when the indicator moves above the zero line from below. A sell signal is created when the indicator moves below the zero line from above. One can close the trade and exit when an opposite signal is observed.
Traders and investors use histograms to gain insights into the momentum and direction of a security or market. Overall, histograms are a valuable tool in technical analysis for visualizing the difference between two variables and identifying potential trading opportunities.
Phew! That was quite an intense topic. Let us quickly summarize our key learnings.
Summary
- We calculate MACD using two exponential moving averages (EMAs) of different lengths, typically 12 and 26 periods, and a signal line, a 9-period EMA of the MACD line.
- The MACD can also be used to identify divergence, which occurs when the price of a security is moving in the opposite direction of the MACD indicator. This can signify a potential trend reversal or a change in momentum.
- The Stochastic Oscillator oscillates between 0 and 100 and is plotted on a chart. Readings above 80 are considered overbought, indicating that the security may be due for a price correction or reversal. Conversely, readings below 20 are considered oversold, suggesting the security may be due for a price bounce or reversal.
- Histograms can also identify divergences between price and an indicator.
In the upcoming chapter, we will explore more indicators, such as Bollinger Bands and Relative Strength Index (RSI).


Please Enter Email


COMMENT (0)