
Learning Modules Hide
Hide
- Chapter 1: Power of Combined Technical Indicators – Part 1
- Chapter 2: Power of Combined Technical Indicators – Part 2
- Chapter 3: Directional Movement System
- Chapter 4: Rate of Change Indicator (ROC)
- Chapter 5: Comparative Relative Strength Indicator
- Chapter 6: Types of Market Days – Part 1
- Chapter 7: Types of Market Days – Part 2
- Chapter 8: Pivot Points - Part 1
- Chapter 9: Pivot Points – Part 2
- Chapter 10: Value Area Trading – Part 1
- Chapter 11: Value Area Trading – Part 2
- Chapter 1: Introduction to Technical Analysis
- Chapter 2: Introduction to Charts and Chart Types
- Chapter 3: Trends, Support, and Resistances
- Chapter 4: Breakouts, Stops and Reversals
- Chapter 5: Fibonacci Retracements
- Chapter 6: Candlestick Patterns - One and Two Candle Patterns
- Chapter 7: Candlestick Patterns: Three Candle Patterns
- Chapter 8: Chart Patterns
- Chapter 9: Moving Averages and Crossovers
- Chapter 10: Price Volume Confirmation
- Chapter 11: Technical Indicators - Part 1: MACD and Stochastics
- Chapter 12: Technical Indicators - Part 2: Bollinger Bands and Relative Strength Index (RSI)
- Chapter 13: Do’s and Don’ts for Effective Trading Using Technical Analysis
Chapter 5: Fibonacci Retracements
Numbers, especially mathematics, have always fascinated people since time immemorial. Even we have enjoyed a love-hate relationship with mathematical concepts and theories. The subject of Fibonacci retracements is fascinating. It is a mathematical concept that can be a handy tool in technical analysis. To completely comprehend and appreciate the notion of Fibonacci retracements, it is necessary first to understand the Fibonacci sequence. The Fibonacci series' origins may be traced back to ancient Indian mathematical texts, with some claims reaching 200 BC. Nevertheless, Fibonacci numbers were discovered in the 12th century by Leonardo Pisano Bogollo, an Italian mathematician from Pisa known to his companions as Fibonacci.
Understanding Fibonacci sequence
The Fibonacci series is a sequence of numbers beginning with zero and structured in such a way that the value of every number in the series equals the sum of the two numbers before it.
The Fibonacci sequence looks like this:
0, 1, 1, 2, 3, 5, 8, 13, 21, 34, 55, 89, 144, 233, 377, 610…
Take note of the following:
3 = 2 + 1
5 = 3 + 2
8 = 5 + 3
13 = 8 + 5
21 = 13 + 8
Needless to say, the series goes on indefinitely. The Fibonacci sequence has a few intriguing characteristics.
Divide every number in the series by the preceding number (from 55 onwards); the resulting ratio is consistently around 1.618.
For instance, 610/377 = 1.618;
377/233 = 1.618;
233/144 = 1.618
The Golden Ratio, often known as the Phi, is defined as a ratio of 1.618. Fibonacci numbers have a natural link. The ratio may be found in human faces, flower petals, animal bodies, fruits and vegetables, rock formations, and galaxy formations, among other things. Of course, we should refrain from going into this debate since it would take us away from the essential point. Additional investigation into the ratio qualities reveals remarkable consistency when a number in the Fibonacci sequence is split by its immediately subsequent number.
For example:
89/144 = 0.618
144/233 = 0.618
377/610 = 0.618
At this point, keep in mind that 0.618 equals 61.8% when represented as a percentage.
When each number in the Fibonacci series is divided by a number two places higher, there is a similar consistency.
For instance, 13/34 = 0.382, 21/55 = 0.382, 34/89 = 0.382
When stated as a percentage, 0.382 is 38.2%.
Additionally, consistency occurs when a Fibonacci number is split by a number three places higher.
For instance, 13/55 = 0.236, 21/89 = 0.236, 34/144 = 0.236, and 55/233 = 0.236.
When stated as a percentage, 0.236 is 23.6%.
The connection between Fibonacci ratios and stock markets
Before we understand the relevance of Fibonacci ratios in stock trading, let us understand their importance. Fibonacci retracements are a popular tool used in technical analysis to identify potential support and resistance levels in a price chart. This tool's relative importance is realizing that the prices tend to retrace a predictable portion of a move, after which they may continue in the original direction. Traders use Fibonacci retracements to identify potential entry and exit points and set stop-loss orders.
The Fibonacci ratios, which are 61.8%, 38.2%, and 23.6%, are said to be used in stock charts. Whether there is a noteworthy up-move or down-move in pricing, Fibonacci analysis can be used. Whenever the stock makes a significant upward or downward move, it tends to retrace back before the next move. For example, if a stock has risen from Rs.50 to Rs.100, it will likely retrace to Rs.70 before rising to Rs.120. To understand this phenomenon in relation with the ratios, check the following example with their charts.
The retracement level forecast is a strategy that can predict how far a pullback can go. These retracement levels offer traders an excellent opportunity to start new positions in the trend direction. The Fibonacci ratios, 61.8%, 38.2%, and 23.6%, assist the trader in determining the potential extent of the retracement.
Let us consider a practical example here. Look at the chart below.
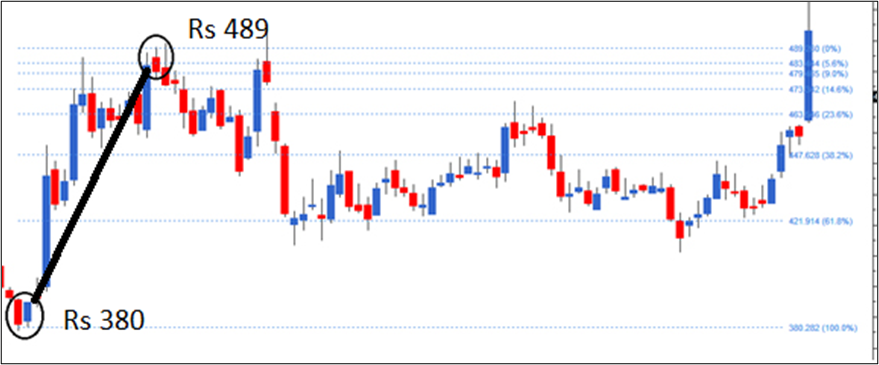
In the above chart, let us assume that the price rally starts at Rs 380. The rally ends at Rs 489. We have joined the two price points. The rapid growth of Rs 109 (489 – 380) can be called a Fibonacci up move. After this rally, you can anticipate a correction according to Fibonacci ratios. The first level to which the stock might correct is 23.6%. If this stock continues to fall, traders should keep an eye on the 38.2% and 61.8% levels.
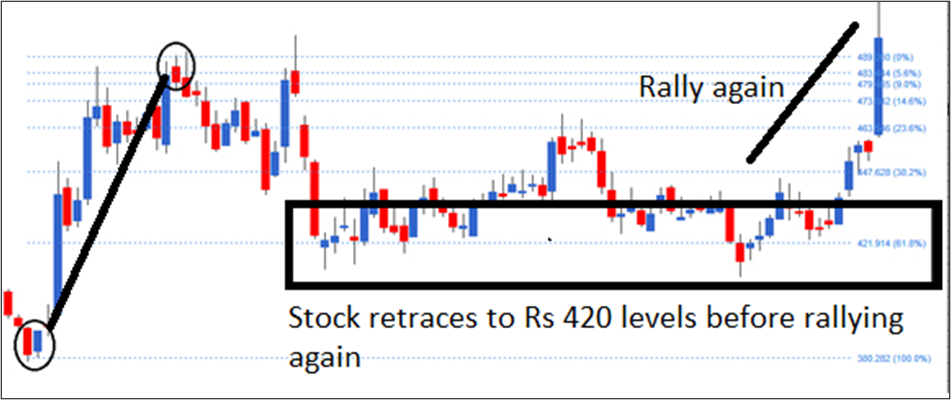
The stock, in case of our example has retraced to 61.8% levels which are around Rs 420. If you look at the above chart, it continues to trade at that level for some time before rallying again.
We may also get Rs 420 levels by using basic math:
Fibonacci up move total = 109
61.8% of Fibonacci up move = 61.8% * 109 = 67.36
61.8% retracement = 489 - 67.36 = 421.6, around our Rs 420 levels.
Using Fibonacci retracements effectively
Consider a case in which you intended to purchase a specific stock but could not do so due to a significant increase in the stock's price. In such a case, the most logical course of action would be to wait for a pullback in the stock. Fibonacci retracement levels like 61.8%, 38.2%, and 23.6% are possible levels for a stock to correct. The trader can detect these retracement levels and position himself for an entry opportunity by charting the Fibonacci retracement levels. But, like with any signal, the Fibonacci retracement should be used as a confirmation tool.
These Fibonacci retracement levels provide an excellent chance for traders to enter new positions in the trend's direction. Typically, a 23.6% retracement is shallow and suited to short-term pullbacks. On the other hand, the 61.8% retracement is significantly deeper, which is known as the golden ratio and is a critical level. Retracements in the 38.2% - 50% region, on the other hand, may be regarded as a moderate correction.
Let us now quickly summarize our key learnings from this chapter.
Summary
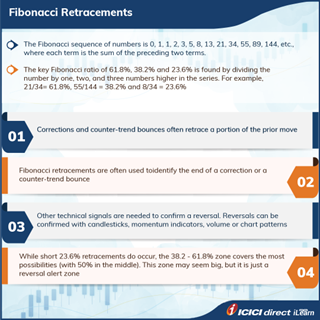
- Fibonacci retracement is based on the Fibonacci sequence.
- Traders think the Fibonacci series may be used to identify probable retracement levels in stock charts.
- Fibonacci retracements are the levels (61.8%, 38.2%, and 23.6%) that a stock can retrace before resuming its initial directional trend.
- The trader might consider opening a fresh trade at the Fibonacci retracement level. But, before proceeding with the deal, additional elements on the checklist should be confirmed.
Congratulations on the successful completion of another chapter. In the next chapter, we shall understand some popular one and two candle patterns.


Please Enter Email


COMMENT (0)