
Learning Modules Hide
Hide
- Chapter 1: Power of Combined Technical Indicators – Part 1
- Chapter 2: Power of Combined Technical Indicators – Part 2
- Chapter 3: Directional Movement System
- Chapter 4: Rate of Change Indicator (ROC)
- Chapter 5: Comparative Relative Strength Indicator
- Chapter 6: Types of Market Days – Part 1
- Chapter 7: Types of Market Days – Part 2
- Chapter 8: Pivot Points - Part 1
- Chapter 9: Pivot Points – Part 2
- Chapter 10: Value Area Trading – Part 1
- Chapter 11: Value Area Trading – Part 2
- Chapter 1: Introduction to Technical Analysis
- Chapter 2: Introduction to Charts and Chart Types
- Chapter 3: Trends, Support, and Resistances
- Chapter 4: Breakouts, Stops and Reversals
- Chapter 5: Fibonacci Retracements
- Chapter 6: Candlestick Patterns - One and Two Candle Patterns
- Chapter 7: Candlestick Patterns: Three Candle Patterns
- Chapter 8: Chart Patterns
- Chapter 9: Moving Averages and Crossovers
- Chapter 10: Price Volume Confirmation
- Chapter 11: Technical Indicators - Part 1: MACD and Stochastics
- Chapter 12: Technical Indicators - Part 2: Bollinger Bands and Relative Strength Index (RSI)
- Chapter 13: Do’s and Don’ts for Effective Trading Using Technical Analysis
Chapter 8: Chart Patterns
Some prominent one, two and three-candle patterns you have learned should set the tone for commencing your technical analysis journey. However, there are more patterns that you need to know before venturing out into the world of technical analysis on your own. Consider this as learning to swim! The more you practice and master different styles, the more chances of you have of winning competitive swimming competitions.
By now, you must have realized that these patterns help us identify transitions between an uptrend and a downtrend. Chart patterns are important in technical analysis because they provide valuable insights into the behavior of the financial markets. They are also important because they provide signals for buying and selling, identify trends, predict future price movements and provide a framework for analysis. When a pattern indicates a shift or a change in the current trend, we call them reversal patterns. A continuation pattern confirms that the existing trend will continue despite a brief pause.
Triangle patterns
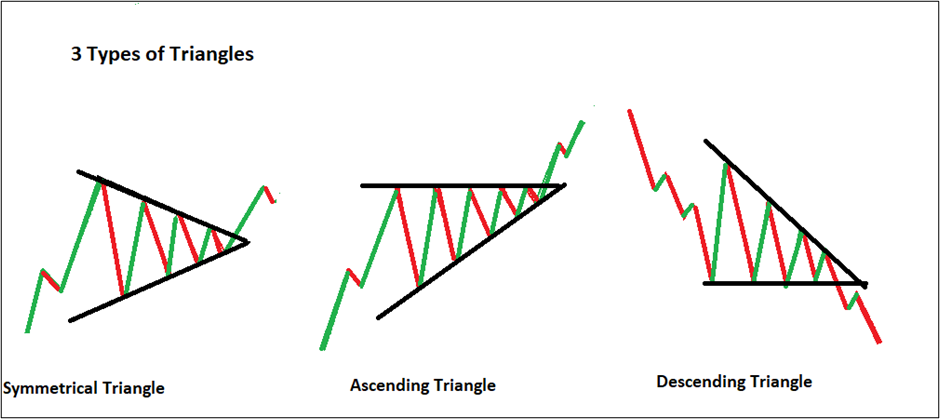
Triangle patterns are a commonly used tool in technical analysis. Any pattern for that matter will help you to identify trends and forecast future outcomes so that you can trade more confidently. Triangle patterns are formed when the price of an asset consolidates between two converging trend lines, creating a triangular shape on a price chart. Triangle patterns help us identify the continuation of bullish or bearish trends in the market. They also help in identifying a potential market reversal. Triangle patterns are of three types: ascending, descending, and symmetrical. Have a look at the image below to understand the three. You can use the picture for visualization and reference.
Ascending triangle
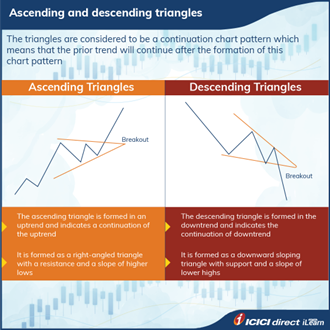
An ascending triangle is formed when the upper trend line, which represents resistance, is horizontal, while the lower trend line, which represents support, is sloping upwards. An ascending triangle indicates bullishness in the markets and signals an upside breakout.
Descending triangle
A descending triangle is formed when the lower trend line, which represents support, is horizontal, while the upper trend line, which represents resistance, is sloping downwards. Descending triangle indicates bearishness in the markets and signals a potential downside breakdown in the prices.
Symmetrical triangle
A symmetrical triangle is formed when the upper and lower trend lines are both sloping towards each other, creating a converging point. Symmetrical triangles form where the price action is becoming increasingly narrow. It indicates a potential breakout in either direction. There could be a breakout, either up or down. These are usually formed when the rally is small and the rally lasts for a short time.
Wedges
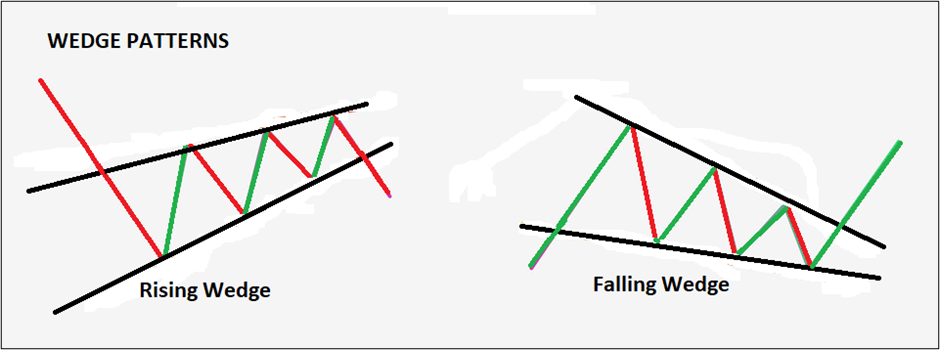
A wedge pattern is identified by converging trendlines on a price chart. Two trendlines connect several highs and lows over specific periods. These lines indicate rising or falling highs and lows over a particular period. This gives the appearance of a wedge as the lines approach showing convergence. In simple words, these wedges form on connecting a major high and a major low. There are two types of wedge patterns; a rising wedge (indicating a bearish reversal) and a falling wedge (indicating a bullish reversal)
Bullish and bearish wedge
A bullish wedge (falling wedge) is a chart pattern that is formed when the asset's price is consolidating within a narrowing range, while the upper trendline is steeper than the lower trendline. This pattern is known as a bullish wedge because it suggests that the asset's price is likely to break out to the upside.
A bearish wedge (rising wedge) chart pattern is also formed when the asset's price is consolidating within a narrowing range, but in this case, the lower trendline is steeper than the upper trend line. This pattern is known as a bearish wedge because it suggests that the asset's price is likely to break out to the downside. Wedge-shaped trendlines indicate a potential price reversal.
Look at the following image for a better understanding of the same. You should also note that the volume tends to decrease when wedges form. In both these cases, there are three characteristics;
a. Converging trendlines
b. As the price progresses, the volumes decline
c. A breakout from one of the trendlines
Channels
The Channel pattern provides price levels for effective entry and exit. This helps in better risk management through the effective use of a stop-loss. You can use the channel pattern in four steps;
a. Identifying channels
b. Deciding when to enter,
c. Deciding the stop loss levels, and
d. Deciding when to exit
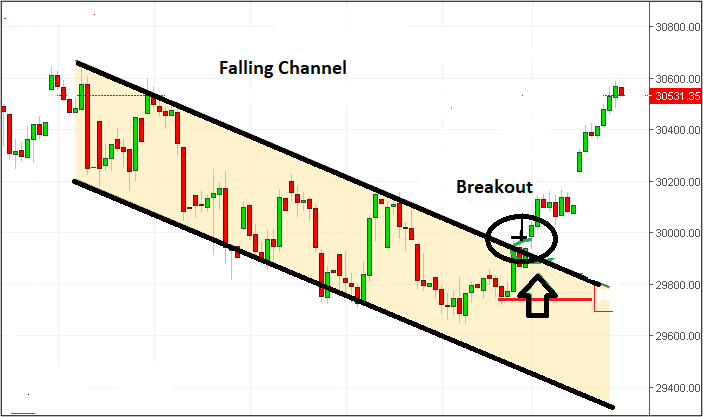
A channel pattern typically occurs when the stock price moves between two parallel trendlines. The upper trendline is formed by connecting the highs for a certain period, whereas the lower trendline is formed by connecting the lows. The shape of the channel can be such that it can slant upwards, downwards, or move sideways.
If the price breaks out on the channel's upside, it indicates that the price will rally further. If the price breaks below the lower trendline, it indicates that more selling will happen, and the price may fall further. Look at the following chart to understand this better.
Did you know?
Sideways channels are also known as ‘Rectangles’. It is a continuation pattern and indicates that the current trend will continue after a brief pause. This brief pause represents the sideways pattern.
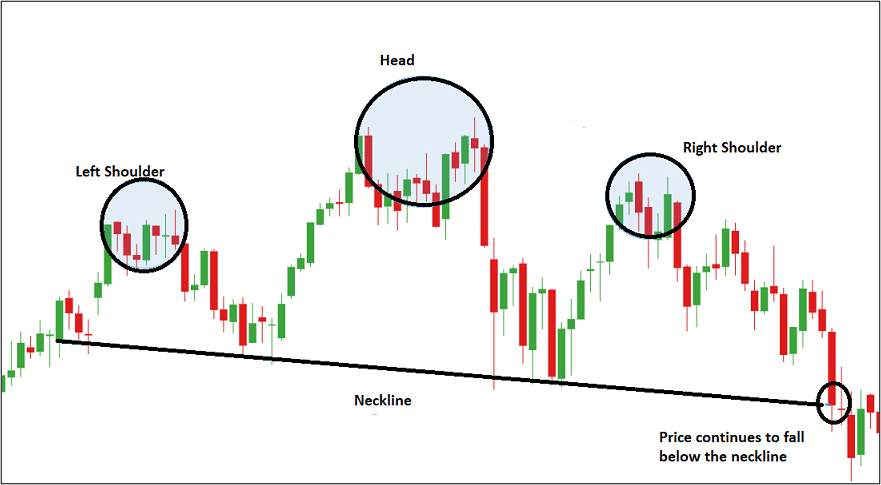
Head and Shoulder pattern
By now, you should have realized that recognizing patterns and understanding their significance is vital to successful trading. The following pattern is the head and shoulder pattern. The left shoulder forms after a significant bull run. However, the price falls only to rise again to create a head. The price falls again only to rise and fall one more time to form the right shoulder. The right shoulder is almost similar in appearance to the first one. The formation of the right shoulder indicates a reversal in the trend. The price falls below the neckline and continues to drop further. The neckline refers to the horizontal line connecting the two troughs.
Refer to the following picture for a better understanding.
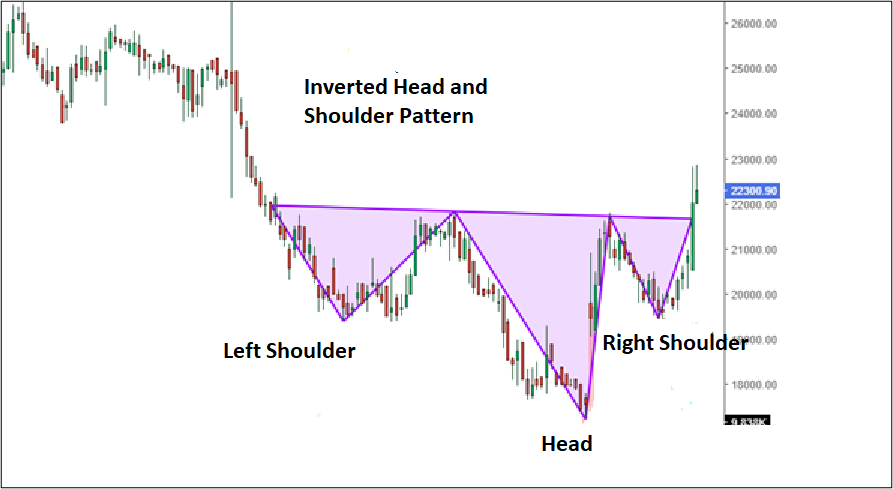
The head and shoulder pattern also appears in the opposite direction signaling a reversal from bearish to bullish. We call it the ‘inverse head and shoulder’ pattern. It looks exactly the opposite of the pattern described above.
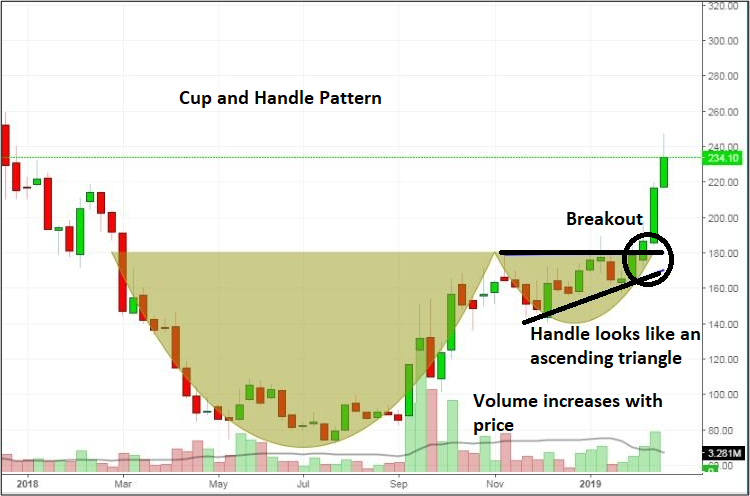
Cup and Handle pattern
This pattern as the name suggests looks like a cup with a handle. This is a bullish pattern. This pattern may take anywhere between a few weeks to several months to form. There are a few things to bear in mind while detecting cup and handle patterns. The length of the cup or the ‘U’ shape is important. A cup with a long and well-rounded ‘U’ shape provides a stronger signal. Stay away from a deep cup and handle pattern. In fact, the handle should form in the first half of the cup. Another element to monitor is the volume levels. Volumes should decline as the prices decline and should increase with the price rise.
Check the following chart to understand this better.
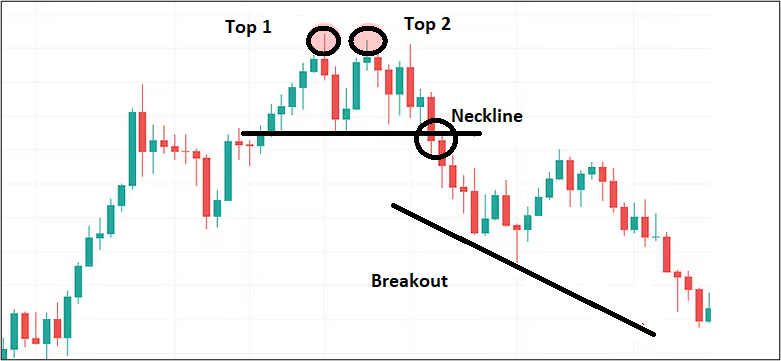
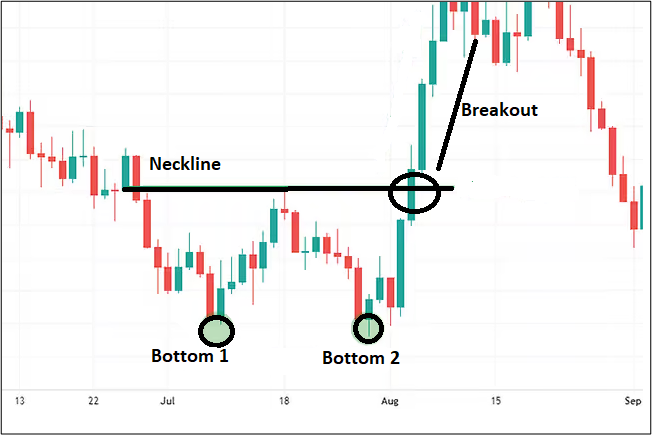
Double top and bottom pattern
Double top and bottom patterns can be identified when the price patterns make a distinct 'W' (double bottom) or 'M' (double top). A double top pattern is a technical analysis chart pattern that occurs when a security's price reaches a high level twice with a moderate decline in between. It is identified by two peaks of approximately the same height formed on a price chart.
The double top pattern is considered a bearish reversal pattern, indicating that the upward trend has reached its maximum and is likely to reverse and move downward. A double bottom occurs when a security's price reaches a low level twice with a moderate rebound in between. It is identified by two bottoms of approximately the same depth formed on a price chart. The double bottom pattern is considered a bullish reversal pattern, indicating that the downward trend has reached its maximum and is likely to reverse and move upward.
Traders use these patterns to understand price movements so that a trading strategy can be set up. This pattern takes some time to evolve, and chances are high that you will often not observe a perfect 'M' or 'W.' You also need to note that the peaks formed by the highs and the troughs formed by the lows do not have to reach the same points for these patterns to appear. These patterns need to be combined with other indicators as they can be misleading and indicate a fake reversal.
The double top ('M' pattern) is formed from two rounding tops indicating a bearish reversal. These form after an extended bull rally. It indicates exhaustion and resistance.
The double-bottom patterns are the exact opposite of the double-top patterns. These patterns will typically appear at the very end of a bearish trend and indicate the exhaustion of the bear run. This is a bullish reversal pattern, and traders usually go long on the security.
Triple tops and bottoms are also patterns that are very similar to double tops and bottoms. The only difference is one more top and bottom. In the case of a triple top, the bulls try to push the prices one more time before a reversal occurs. Similarly, in the case of a triple bottom, bears try to push down the prices one more time before a reversal occurs.
Phew! The concepts explained in this chapter may sound a bit overwhelming, but practice will make you perfect indeed.
Let us quickly summarize our key takeaways from this chapter.
Summary
- An ascending triangle indicates bullishness in the markets and signals an upside breakout whereas a descending triangle indicates bearishness in the markets and signals a potential downside breakout in the prices.
- A channel pattern occurs when the price movement happens between two parallel trendlines.
- A head and shoulder and its inverse are a highly reliable reversal pattern. It appears at the top of the trend whereas the inverse head and shoulder appear at the bottom of the trend.
- A cup and handle pattern may take anywhere between a few weeks to several months to form and indicates bullishness. Look at the volume data as well to decide whether the trend will continue or reverse.
- Double and triple bottoms appear at the very end of the downtrend and indicate a strong potential reversal. The bottoms are bullish reversal whereas the tops are bearish reversal patterns.
We would be covering some crucial topics in the next chapter. In fact, the next chapter talks about Moving Averages, their types, usage, and crossovers.


Please Enter Email


COMMENT (0)