
Learning Modules Hide
Hide
- Chapter 1: Power of Combined Technical Indicators – Part 1
- Chapter 2: Power of Combined Technical Indicators – Part 2
- Chapter 3: Directional Movement System
- Chapter 4: Rate of Change Indicator (ROC)
- Chapter 5: Comparative Relative Strength Indicator
- Chapter 6: Types of Market Days – Part 1
- Chapter 7: Types of Market Days – Part 2
- Chapter 8: Pivot Points - Part 1
- Chapter 9: Pivot Points – Part 2
- Chapter 10: Value Area Trading – Part 1
- Chapter 11: Value Area Trading – Part 2
- Chapter 1: Introduction to Technical Analysis
- Chapter 2: Introduction to Charts and Chart Types
- Chapter 3: Trends, Support, and Resistances
- Chapter 4: Breakouts, Stops and Reversals
- Chapter 5: Fibonacci Retracements
- Chapter 6: Candlestick Patterns - One and Two Candle Patterns
- Chapter 7: Candlestick Patterns: Three Candle Patterns
- Chapter 8: Chart Patterns
- Chapter 9: Moving Averages and Crossovers
- Chapter 10: Price Volume Confirmation
- Chapter 11: Technical Indicators - Part 1: MACD and Stochastics
- Chapter 12: Technical Indicators - Part 2: Bollinger Bands and Relative Strength Index (RSI)
- Chapter 13: Do’s and Don’ts for Effective Trading Using Technical Analysis
Chapter 3: Trends, Support, and Resistances
“The whole internet is on fire with this new song. The singer is an absolute sensation, and his song is currently trending”. We often encounter such statements when a trend goes viral on social media platforms. In technical analysis, too, we look at the trend. Trend analysis is integral to technical analysis, and chartists often swear by it. “Trend is your best friend” is valid for a chartist.
Let us understand trends in technical analysis in detail:
What is a trend?
Prices never move in a linear or a straight line and often move in a ‘zigzag’ manner. This zigzag pattern describes the peaks and troughs developed by price action. Trend refers to the general direction in which the prices are currently moving. Peaks and troughs typically constitute a trend.
Types of Trends
The kind of trend depends on the direction of the trend. Based on the direction, there are three types of trends:
- Uptrend
- Downtrend
- Sideways trend
-
Uptrend:
An uptrend comprises prices (peaks and troughs) moving upward. It is made up of higher highs and higher lows. Look at the following figure to understand an uptrend better.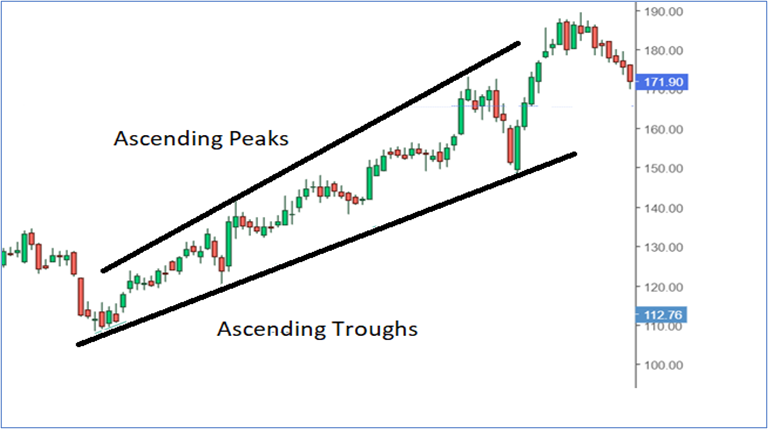
-
Downtrend:
Descending peaks and troughs make for a downtrend. In other words, a downtrend has lower highs and lower lows. The same is seen in the following figure.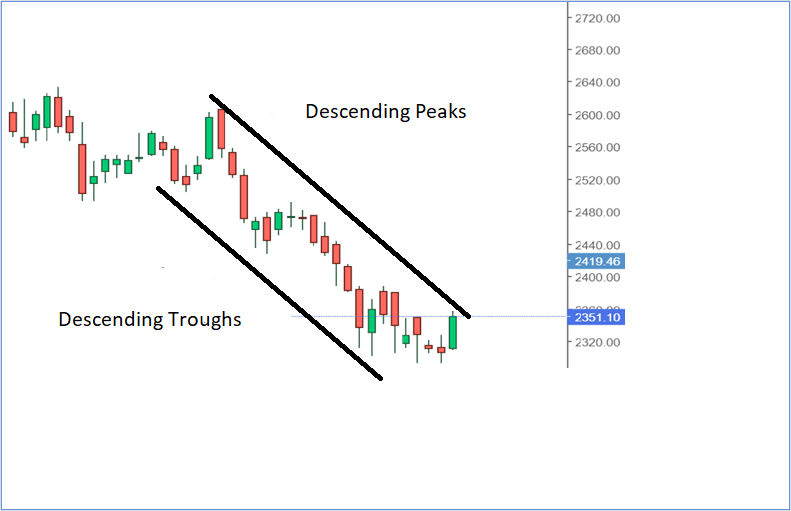
-
Sideways trend:
Also known as consolidation, this trend occurs when the prices move sideways. The same is seen in the following figure.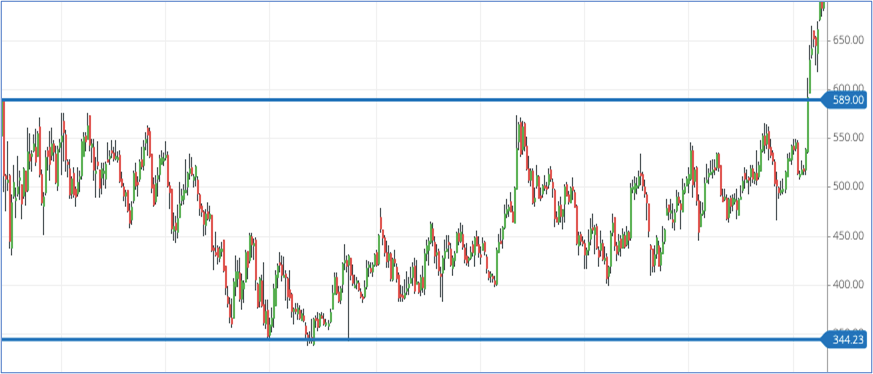
Understanding trendlines
Now that you know the meaning of a trend, you should also be well-versed in drawing trendlines. A trendline is formed when you join two or more price points. Understanding trendlines is essential not only because it helps you to identify the underlying trend but also helps in confirming the trend. (P.S. Remember the Dow theory we covered in the earlier chapter? One of the six tenets of the theory is that stock prices move in trends). We identify and measure trends using trendlines. Markets move up or down due to increased demand and supply. Trendlines, help you identify areas of increased demand and supply. All this translates into timely identifying trading (buying and selling) opportunities.
There are two prominent types of trendlines:
Support trendline
Take a look at the chart below.
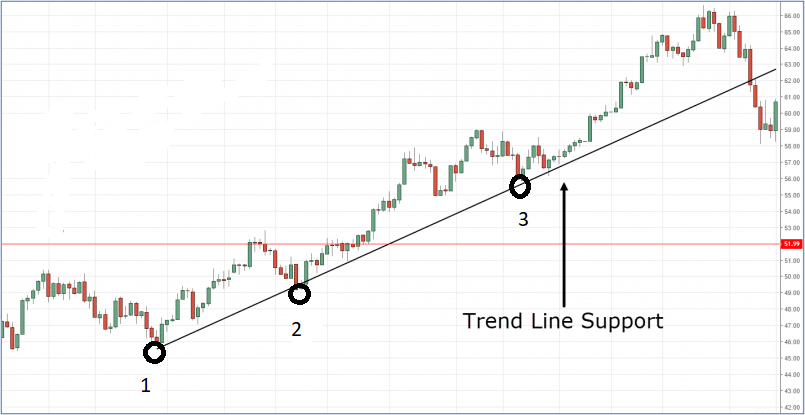
The above chart shows a trendline (connecting points 1, 2, and 3) by joining points 1 and 2. By extending the straight line, we can see that prices have also taken support (not falling below the line) at point 3. The chart clearly shows that there were buying opportunities at these points that you can exploit.
Resistance trendline
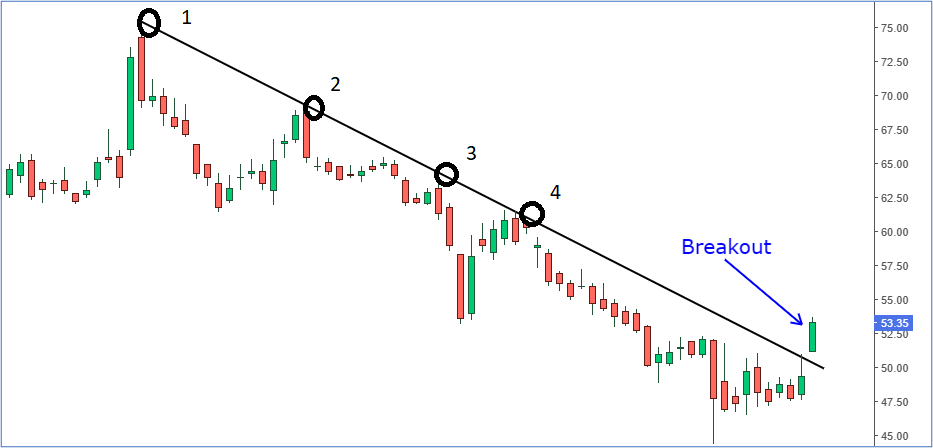
The above chart depicts a downtrend. Every time the price approaches the line, you will notice that they face resistance and start trading lower. The trendline that you see is the resistance line. After facing resistance at points 3 and 4, the prices continue to trade lower.
Typically, a trendline will have three points. (you can check the support trendline and resistance trendline images for reference)
The first point (Point 1) is known as the initiating point. This is the point from where we start drawing our trendline. Remember that you need at least two price points to draw a trendline.
The second point (Point 2) is also called the confirming point. It confirms the straight line (the underlying trend).
The third point (Point 3) is called the validating point. This point is essential as it confirms the validity of the trendline. Please note that any two reference price points can offer a trendline. However, it is the third point that validates the existence of the trend. So always look for that third point instead of heavily relying on the slope of the line connecting the first two points.
Did you Know?
A trend may have multiple trendlines. These multiple trendlines are based on different time frames. Let's say you are considering a long-term uptrend or downtrend (long-term is relative to your time frame of chart). You will likely be able to draw multiple trendlines, as there could be multiple lows and highs that can be connected. A short-term chart will showcase smaller price swings that otherwise are not visible on a relatively long-term chart.Traders and investors can view different trendlines and trends for different time frames.
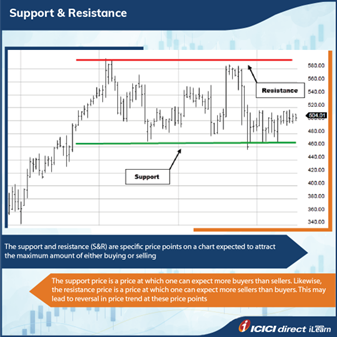
Support and Resistance
We looked at support and resistance trendlines. But what exactly is meant by support and resistance? Support and resistance are two fundamental concepts in technical analysis. So, what exactly is support? In a downtrend, the stocks tend to trade lower as the prices fall due to excess supply over demand. The lower the prices, the more attractive the stock becomes to those investors wanting to buy them. At some point, this price will rise to match the supply. The stock price will stop falling at this price point as supply (excessive sellers) have enough buyers (representing demand). This is called support. In simple words, buyers should ideally replace sellers, thus arresting the price fall. Also, you should note here that the price stops falling further and reverses.
Understand resistance to be precisely the opposite of support. Prices tend to increase when the stock's demand exceeds its supply. As the prices continue to move higher, there comes the point where investors would desire to sell the stock than continue to buy. This could be for various reasons, like the traders would have met their target or they feel that the price rise needs to be lowered. Resistance is called the price level, where the price rise stops as supply overpowers demand.
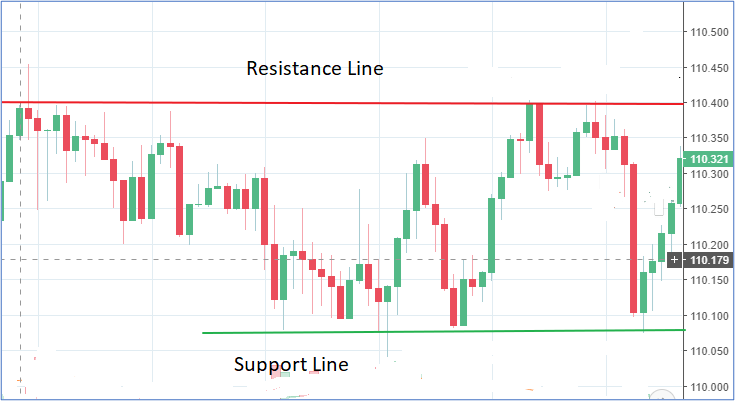
Support and Resistance lines create a channel within which stock is usually found to trade. However, substantial volumes may push the prices above the resistance line and below the support line. This is called a ‘price breakout.’ When the price breaks the resistance line, the current resistance line becomes the new support line. On the other hand, if the price breaks the current support line, the current support becomes the further resistance. During a breakout, the trader will take up a long position of the price breaks above the resistance and enter into a short place when the price breaks below the support.
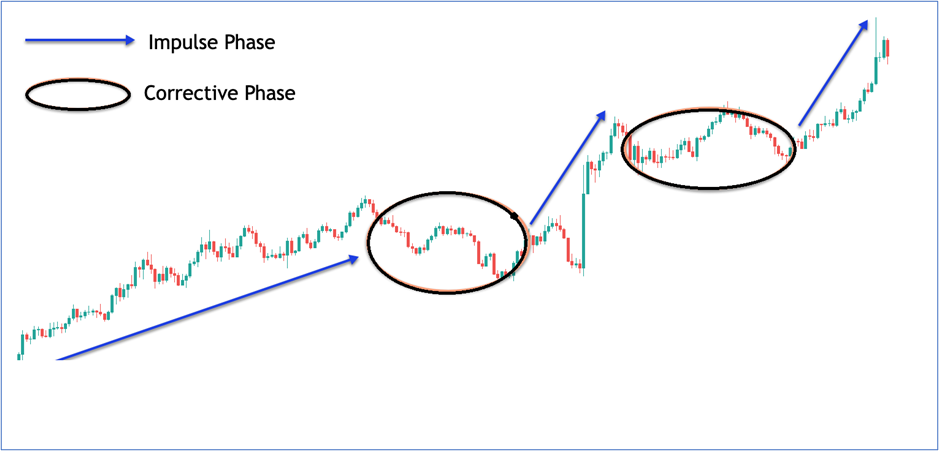
Impulse and corrections
Before we venture further into the ocean of technical analysis in the upcoming chapters, let us understand a basic market phenomenon. Just as the ocean tides move in sync with nature, every market ebbs and flows in sync with daily news and events. These news and events include everything that impacts the market, like changes in interest rates, election results, etc. Looking at any price chart, you will find the price moving up and down. This is due to market reactions to daily news and events.
You need to understand the movement of the prices to achieve tremendous trading success. This is where the concept of impulse and corrections come into the picture. Consider impulsive moves that push the prices to newer heights during an uptrend. During a downtrend, impulsive moves push the price down to create newer lows.
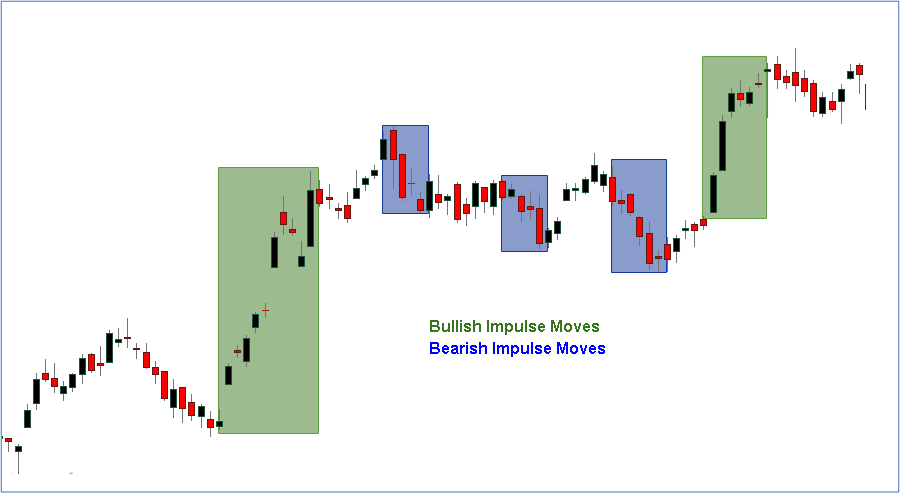
You can notice in the above chart that impulse movements are highly aggressive and swift. This translates to a huge profit potential in less time.
Corrective moves lie on the exact opposite side of the spectrum. These are price movements that work against the existing trend. These counter-trends represent a period of consolidation. These movements are relatively weaker and less aggressive than impulsive moves. A correction during an uptrend is characterized by a movement lower than the previous move or even a sideways movement.
You can set up price action strategies based on the above to maximize profit potential. We shall learn those in the later chapters. Now that we have covered some rather important topics, let us quickly go through the key takeaways.
Summary
- Trend refers to the general direction in which the prices are currently moving in.
- There are three trends; uptrend, downtrend, and sideways.
- A sideways trend is also called consolidation.
- A trendline is formed when you join two or more price points. Understanding trendlines is essential not only because it helps you to identify the underlying trend but also helps in confirming the trend.
- Corrections are counter-trends that represent periods of consolidation.
- Support and resistance help you to understand the correct entry and exit price points.
We shall learn breakouts, reversals and other essential elements in the next chapter.


Please Enter Email


COMMENT (0)