
Learning Modules Hide
Hide
- Chapter 1: Power of Combined Technical Indicators – Part 1
- Chapter 2: Power of Combined Technical Indicators – Part 2
- Chapter 3: Directional Movement System
- Chapter 4: Rate of Change Indicator (ROC)
- Chapter 5: Comparative Relative Strength Indicator
- Chapter 6: Types of Market Days – Part 1
- Chapter 7: Types of Market Days – Part 2
- Chapter 8: Pivot Points - Part 1
- Chapter 9: Pivot Points – Part 2
- Chapter 10: Value Area Trading – Part 1
- Chapter 11: Value Area Trading – Part 2
- Chapter 1: Introduction to Technical Analysis
- Chapter 2: Introduction to Charts and Chart Types
- Chapter 3: Trends, Support, and Resistances
- Chapter 4: Breakouts, Stops and Reversals
- Chapter 5: Fibonacci Retracements
- Chapter 6: Candlestick Patterns - One and Two Candle Patterns
- Chapter 7: Candlestick Patterns: Three Candle Patterns
- Chapter 8: Chart Patterns
- Chapter 9: Moving Averages and Crossovers
- Chapter 10: Price Volume Confirmation
- Chapter 11: Technical Indicators - Part 1: MACD and Stochastics
- Chapter 12: Technical Indicators - Part 2: Bollinger Bands and Relative Strength Index (RSI)
- Chapter 13: Do’s and Don’ts for Effective Trading Using Technical Analysis
Chapter 9: Moving Averages and Crossovers
As students, we have all learned averages in school. Moving average is taking that concept further and using that in Technical Analysis. Traders prefer moving averages for their simplicity and effectiveness. These are trend indicators and help to identify the direction of the trend and the support and resistance levels.
But school was a long time ago. This illustration on averages should refresh your memory. Let's say a school classroom sees an attendance of 55, 57, 46, 45, 52 students on five days. The average attendance over five days is (55+57+46+45+52) / 5 = 51.
Now let us understand the concept of moving averages. Assume a stock has registered a closing price of 221, 223, 224, 222, and 225 in the last 5 days. The average price in the last 5 days would be Rs 223 [(221+223+224+222+225)/5]. On days 6 and 7, the stock registers a different closing price of 227 and 226, the new average of the last 5 trading days would be Rs 224.80[(224+222+225+227+226)/5]. As we move to recent trading days, newer data points are available for us to consider to calculate the average. This is precisely what the moving average is.
Did you know?
Most traders prefer to use the closing price to calculate moving averages as it reflects the price at which the stock settled on that day. Depending on your trading requirements, you can also choose any timeframe (from minutes, hours, or even years) to calculate the moving average.
Moving averages
Moving averages are a popular tool used in technical analysis to help traders identify trends and make informed trading decisions. A moving average is a calculation that takes the average price of an asset over a set period of time, typically a certain number of days or weeks. The average is then plotted on a chart to help traders see the overall asset price movement trend.
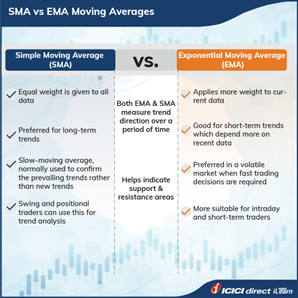
Two main types of moving averages are used in technical analysis: Simple Moving Averages (SMA) and Exponential Moving Averages (EMA).
Both SMA and EMA are commonly used to identify trend directions, support and resistance levels, and potential buying or selling opportunities. Traders often use them in combination with other technical indicators to make more informed trading decisions.
Simple Moving Averages (SMA)
A Simple Moving Average (SMA) is calculated by taking the average of an asset’s closing price over a set period of time. For example, a 20-day SMA would take the asset’s closing price average over the last 20 days. The SMA is then plotted on a chart to help traders see the overall asset price movement trend.
One of the main uses of SMAs is to identify the trend of an asset. If the asset’s price is above its SMA, it is generally considered to be in an uptrend, while if it is below its SMA, it is considered to be in a downtrend.
Exponential Moving Averages (EMA)
An Exponential Moving Average (EMA) is similar to a Simple Moving Average, but places more weight on recent price data. This moving average reacts more quickly to recent price changes and is therefore considered more sensitive to short-term price movements.
One of the main uses of EMAs is to identify short-term trends. Because EMAs react more quickly to recent price changes, they are often used by traders to make quick buy or sell decisions based on short-term trends.
Let us learn how EMA is calculated; here's an example of how to calculate an Exponential Moving Average (EMA) for a stock over a 10-day period:
- Choose the time period for which you want to calculate the EMA (in this case, we'll use a 10-day period).
- Obtain the closing prices for the stock for the last 10 days.
- Calculate the SMA for the 10-day period by adding up the closing prices for the 10 days and dividing the sum by 10.
- Choose a smoothing factor (a constant that determines the weight given to each price in the EMA calculation) - for this example, we'll use a smoothing factor of 0.2. The smoothing factor can be calculated by the formula 2 / (Selected period +1). For ten days, it comes out 2 / (10+1) = 0.18. To simplify the calculation, we are taking this factor to 0.2.
- Calculate the EMA for day 10 by using the formula: EMA = (Closing price - EMA (previous day)) x smoothing factor + EMA (previous day).
- Repeat the process for each subsequent day, using the EMA calculated for the previous day in step 5 as the EMA (previous day) for the current calculation.
Consider the following example with reference to the above.
Here's an example of the calculation for the 10-day EMA for a hypothetical stock:
Day 1: Closing price = Rs 50.00
Day 2: Closing price = Rs 52.00
Day 3: Closing price = Rs 53.50
Day 4: Closing price = Rs 55.25
Day 5: Closing price = Rs 56.50
Day 6: Closing price = Rs 57.75
Day 7: Closing price = Rs 58.50
Day 8: Closing price = Rs 59.25
Day 9: Closing price = Rs 58.75
Day 10: Closing price = Rs 57.50
SMA (10-day) = (50 + 52 + 53.5 + 55.25 + 56.5 + 57.75 + 58.5 + 59.25 + 58.75 + 57.5) / 10 = Rs 55.9
EMA (10-day) Day 1 = Rs 50.00
EMA (10-day) Day 2 = (52.00 - 50.00) x 0.2 + 50.00 = Rs 50.40
EMA (10-day) Day 3 = (53.50 - 50.40) x 0.2 + 50.40 = Rs 51.02
EMA (10-day) Day 4 = (55.25 - 51.02) x 0.2 + 51.02 = Rs 51.87
EMA (10-day) Day 5 = (56.50 - 51.87) x 0.2 + 51.87 = Rs 52.80
You can calculate the EMA for remaining days on similar lines.
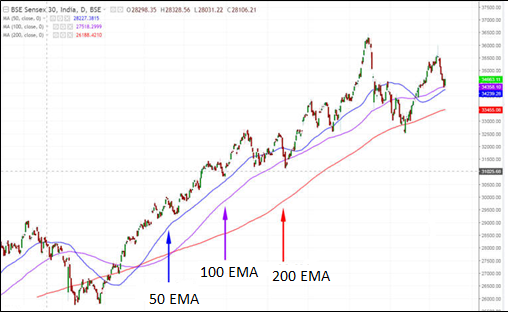
The 20-day, 50-day, 100-day, and 200-day moving averages are popular moving averages used by traders to help identify trends and make trading decisions.
Traders often use the 20-day moving average to identify short-term trends. This moving average is particularly useful for traders who are looking for quick buy or sell signals based on short-term price movements.
The 50-day moving average is often used to identify intermediate-term trends. This moving average is particularly useful for traders who are looking for a longer-term perspective on the trend of an asset.
The 100-day and 200-day moving averages are often used to identify long-term trends. These moving averages are particularly useful for traders who are looking for a longer-term perspective on the trend of an asset and are not as concerned with short-term price movements.
You can observe the same in the following chart.
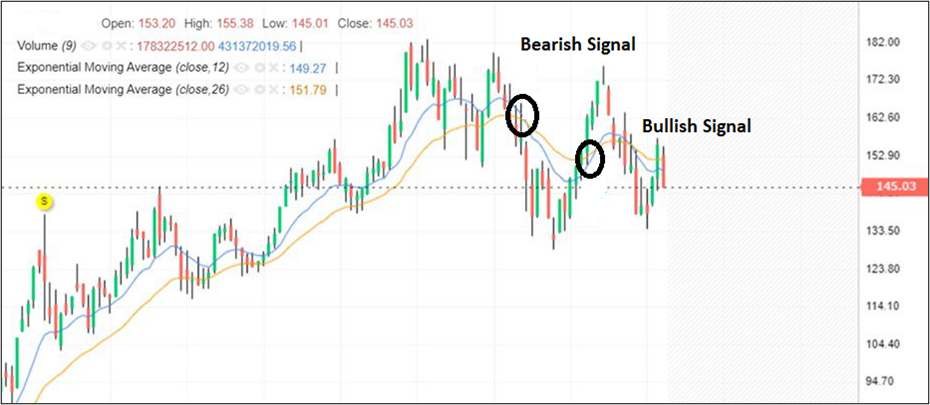
Crossovers
Crossovers are a common technique used by traders to identify trends and make trading decisions. A crossover occurs when a moving average crosses above or below another moving average or the price of an asset.
A bullish crossover occurs when a short-term moving average crosses above a longer-term moving average. This is often considered a buy signal and suggests that the asset’s price will likely rise soon.
A bearish crossover occurs when a short-term moving average crosses below a longer-term moving average. This is often considered a sell signal and suggests that the asset’s price will likely fall soon.
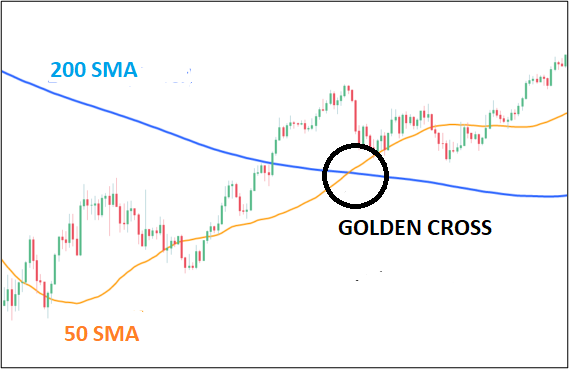
Golden Cross and Death Cross
Let’s say you consider two moving averages – a short-term moving average and a major long-term moving average. When the short-term moving average crosses over the long-term moving average and moves upside, it is considered as a definitive signal of price rise. It is used for a longer-term period. This is also called as the Golden Cross.
Along with this, there is also the Death Cross. A Death Cross is a bearish chart pattern that occurs when a short-term moving average crosses below a long-term moving average. The term "Death Cross" is used because it typically signals a potential reversal of a bullish trend into a bearish trend Look at the following figure to understand the golden cross better.
In conclusion, moving averages and crossovers are popular tools used in technical analysis to help traders identify trends and make informed trading decisions. While they can be useful in helping traders make decisions, you can effectively use them to predict price movements
Summary
- Technical analysis uses two main types of moving averages: Simple Moving Averages (SMA) and Exponential Moving Averages (EMA).
- A bullish crossover occurs when a short-term moving average crosses above a longer-term moving average. This is often considered a buy signal and suggests that the asset’s price will likely rise soon.
- A bearish crossover occurs when a short-term moving average crosses below a longer-term moving average. This is often considered a sell signal and suggests that the asset’s price will likely fall soon.
- Golden Cross is when the short-term moving average crosses over the long-term moving average and moves upside.
In the next chapter, we shall look at the relationship between price and volume. We shall learn ‘Price -Volume Analysis’.


Please Enter Email


COMMENT (0)