
Learning Modules Hide
Hide
- Chapter 1: Power of Combined Technical Indicators – Part 1
- Chapter 2: Power of Combined Technical Indicators – Part 2
- Chapter 3: Directional Movement System
- Chapter 4: Rate of Change Indicator (ROC)
- Chapter 5: Comparative Relative Strength Indicator
- Chapter 6: Types of Market Days – Part 1
- Chapter 7: Types of Market Days – Part 2
- Chapter 8: Pivot Points - Part 1
- Chapter 9: Pivot Points – Part 2
- Chapter 10: Value Area Trading – Part 1
- Chapter 11: Value Area Trading – Part 2
- Chapter 1: Introduction to Technical Analysis
- Chapter 2: Introduction to Charts and Chart Types
- Chapter 3: Trends, Support, and Resistances
- Chapter 4: Breakouts, Stops and Reversals
- Chapter 5: Fibonacci Retracements
- Chapter 6: Candlestick Patterns - One and Two Candle Patterns
- Chapter 7: Candlestick Patterns: Three Candle Patterns
- Chapter 8: Chart Patterns
- Chapter 9: Moving Averages and Crossovers
- Chapter 10: Price Volume Confirmation
- Chapter 11: Technical Indicators - Part 1: MACD and Stochastics
- Chapter 12: Technical Indicators - Part 2: Bollinger Bands and Relative Strength Index (RSI)
- Chapter 13: Do’s and Don’ts for Effective Trading Using Technical Analysis
Chapter 1: Introduction to Technical Analysis
Consider this!
Let's say you are on an exotic island vacation and decide to go scuba diving. Whether you are a pro or an amateur diver, you will test not only the waters but also your equipment and weather and make sure that all the conditions for scuba diving are conducive. No sane person will jump in blindly.
This is true for stock investing as well. A rational investor will only blindly put in a little money. That's a sure-shot recipe for disaster. Developing a well-researched point of view is critical. A good point of view should consider the expected direction in which prices are expected to move, the risk-return tradeoff, the holding period, and the price levels to enter and exit.
Technical analysis helps you to do just that.
Emotions like greed and fear dominate market participants and are the key factors driving prices. People react to market events in a predictable manner. Investors who disregard the past tend to think that "this time it is different." However, there is a need to quantify and measure these emotions. This is where Technical Analysis comes into the picture. Technical Analysis quantifies these emotions and helps traders make well-informed decisions.
Before you get into actual trading, you need to develop a particular point of view, especially the potential risk, the potential reward, the holding period, and the price at which you will enter (buy) and exit (sell) the stock. The two data elements that serve as the foundation for the entire field of technical analysis are price over time and volume. These two core informational pieces are the foundation for all patterns, indicators, and concepts. The study of technical analysis is fascinating. This is a probabilistic field of study, not proven science. It is more of an art than a science. There are well-known chart patterns or indicators in the market. But everything functions differently. Because they succeed more frequently than they fail, we continue to believe in them. Technical traders use charts to predict price movements.
Fundamental vs. technical analysis
You are an absolute foodie and love exploring exotic places and cuisines. One way of deciding which food item to try is to observe the chef while preparing the dish. You may check out the different ingredients and the process, inquire with other customers about the taste, quality, and origins, and decide whether to consume that dish. Another easy option is to observe which dish is ordered the most and order the same. Chances are high that the most frequently requested dish will also be the tastiest. The first approach, which seems thorough, is fundamental analysis. It checks out all fundamental factors, analyses them thoroughly, and helps you make investing decisions. On the other hand, the second method is very similar to technical analysis. Technical looks at the collective behavior of the entire market to help you set up a trade.
Regarding stock analysis, Fundamental and Technical analysis are two primary schools of thought. Let us now look at what distinguishes one from the other.
- Technical analysis predicts the price by looking at and applying indicators to charts, whereas fundamental analysis starts with thoroughly evaluating financial statements.
- Fundamental takes a long-term approach to security analysis, whereas technical takes a short-term strategy. Technical analysts try to identify short-term opportunities to profit from, whereas fundamental analysts invest over the long term in undervalued securities.
Did You Know?
Technical analysis uses market activity statistics like volume and price to understand securities better. Chartists (Technical analysts) use chart patterns, technical indicators, or a combination of the two to decide the entry and exit price points. Price is sacred for technical analysts as they see it as a manifestation of every possible market reality.
Assumptions of technical analysis
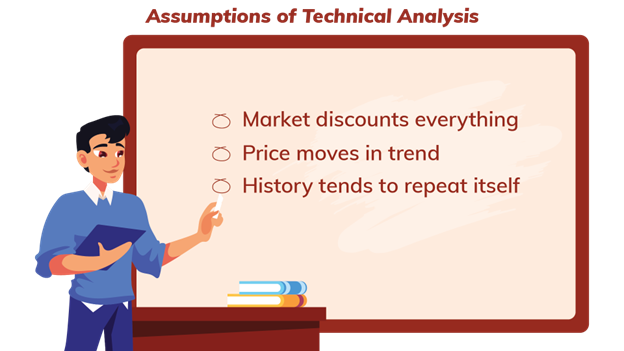
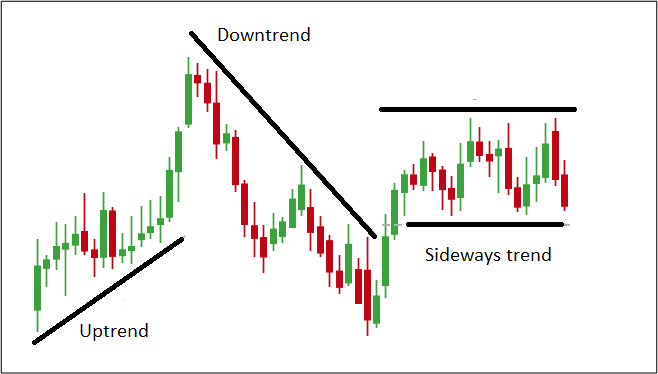
2. Price moves in trend: Price movements are thought to follow trends in technical analysis. A trend refers to the direction in which the prices are moving about where they have been in the past. There are three types of trends: Uptrend (where the prices move up), Downtrend (where the prices are seen moving downwards), and Sideways trend (where the prices are seen moving in a sideways direction). We shall learn more about trends in detail in the upcoming chapters. This means that once a trend has been established, future price movement is more likely to be in its direction than against it. This assumption underpins the majority of technical trading strategies
3. History tends to repeat itself: Another essential concept in technical analysis is that history tends to repeat itself, particularly in terms of price movement. Price movements are repetitive due to market psychology; in other words, market participants tend to respond consistently to similar market stimuli over time. Chart patterns are used in technical analysis to analyze market movements and identify trends.
But, who uses technical analysis?
By now, you must have realized that technical analysis helps identify profitable short-term opportunities. Active traders use chart patterns and technical indicators to decide entry and exit prices. Technical analysis helps professional traders make well-informed trading decisions. You should note that even long-term investors use technical analysis. Such investors use fundamental analysis to identify good stocks and technical analysis to determine the correct entry and exit price points. It is advisable to use fundamental analysis and technical analysis in tandem.
Dow theory and its six tenets
Charles Dow, the founder, and editor of the Wall Street Journal (WSJ) and the co-founder of the Dow Jones Industrial Average, published 255 editorials in the WSJ. William Peter Hamilton, Robert Rhea, and E. George Schaefer compiled critical learnings from the editorials and formed the Dow theory as we know it today. Let us now look at the different tenets of Dow theory.
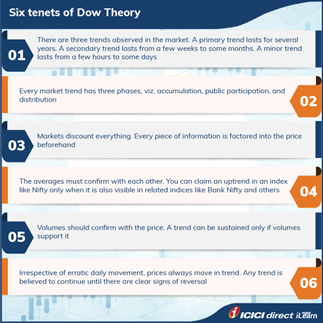
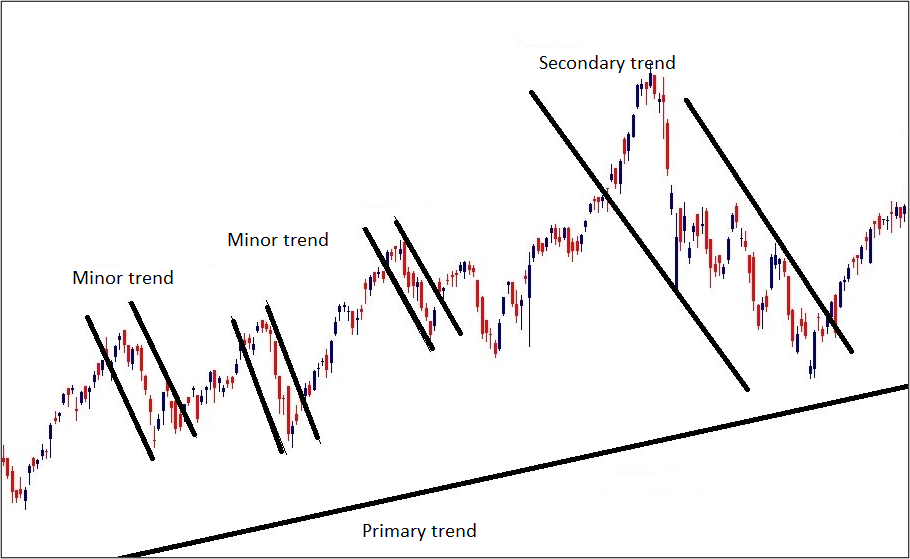
1. There are three trends observed in the market. A primary trend, also called the main trend, lasts for several years. A secondary trend lasts from a few weeks to some months and is found within the primary trend. A minor trend lasts from a few hours to some days. It is the least reliable of all the trends. Most traders discount minor trends as market noise.
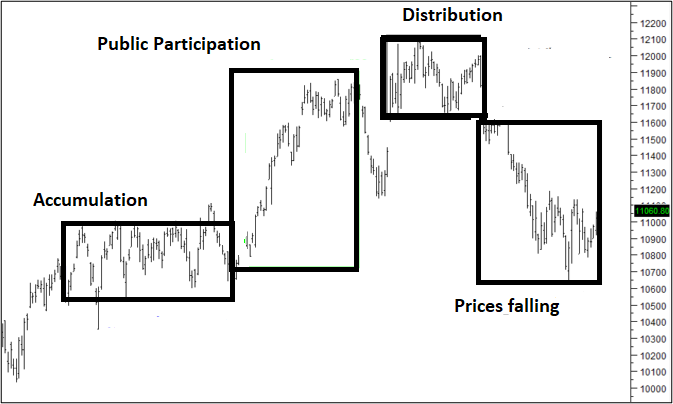
2. Every market trend has three phases, viz. Accumulation (where people buy), Public Participation (where consolidation happens), and Distribution (where sustained selling is observed). Distribution is considered the opposite of Accumulation.
3. Markets discount everything. Every piece of information is factored into the price beforehand. In other words, all information – past, present and future is discounted by traders and is reflected in stock prices.
4. Remember that averages must confirm with each other. You can claim an uptrend only when an index is witnessing an uptrend along with a visible uptrend in other indices within the exchange. The phenomena should be observed in other associated indices as well.
5. Volumes should confirm with the price. A trend can be sustained only if volumes support it. A visible trend with no volumes to support it indicates that the trend will not be sustained. You will learn more about the role of volumes in later chapters.
6. Irrespective of erratic daily movement, prices always move in trend. Any trend is believed to continue until there are clear signs of reversal.
Congratulations! You have completed the 1st chapter in your journey to understand Technical Analysis better. Let us quickly go through some key learnings from this chapter.
Summary
- Emotions like greed and fear take over market participants and are the key factors driving prices.
- Technical analysts use a combination of chart patterns and technical indicators to forecast the prices.
- Technical analysis helps you to identify profitable short-term opportunities. Even long-term investors use technical analysis to find the entry and exit price points.
- Dow theory has six tenets that allow you to understand market trends better.
- A trend has 3 phases – accumulation, participation, and distribution.
- We assume that markets discount every piece of information and that history repeats itself.
In the next chapter, we shall understand the different chart types and the information they convey.


Please Enter Email


COMMENT (0)