
Learning Modules Hide
Hide
- Chapter 1: Power of Combined Technical Indicators – Part 1
- Chapter 2: Power of Combined Technical Indicators – Part 2
- Chapter 3: Directional Movement System
- Chapter 4: Rate of Change Indicator (ROC)
- Chapter 5: Comparative Relative Strength Indicator
- Chapter 6: Types of Market Days – Part 1
- Chapter 7: Types of Market Days – Part 2
- Chapter 8: Pivot Points - Part 1
- Chapter 9: Pivot Points – Part 2
- Chapter 10: Value Area Trading – Part 1
- Chapter 11: Value Area Trading – Part 2
- Chapter 1: Introduction to Technical Analysis
- Chapter 2: Introduction to Charts and Chart Types
- Chapter 3: Trends, Support, and Resistances
- Chapter 4: Breakouts, Stops and Reversals
- Chapter 5: Fibonacci Retracements
- Chapter 6: Candlestick Patterns - One and Two Candle Patterns
- Chapter 7: Candlestick Patterns: Three Candle Patterns
- Chapter 8: Chart Patterns
- Chapter 9: Moving Averages and Crossovers
- Chapter 10: Price Volume Confirmation
- Chapter 11: Technical Indicators - Part 1: MACD and Stochastics
- Chapter 12: Technical Indicators - Part 2: Bollinger Bands and Relative Strength Index (RSI)
- Chapter 13: Do’s and Don’ts for Effective Trading Using Technical Analysis
Chapter 7: Candlestick Patterns: Three Candle Patterns
In the earlier chapters, you have looked at a few one and two-candle patterns. At first, you may find candlesticks to be confusing and overwhelming, with their strange names and shapes. But with practice and perseverance, you will understand their patterns and what they mean for the market. So the question here is, Do candlesticks work? The answer is an overwhelming Yes! Candlesticks certainly work. But their efficiency depends on factors like time and what specific data you are trying to understand. Adding one more variable could improve some of the patterns. Let us dive further to understand candlesticks better.
Gap up and gap down
We concluded the previous chapter with the meaning of the term ‘Gaps.’ Let us now understand it in more detail before learning three candlestick patterns.
A gap occurs when a stock's opening price hugely differs from the previous day's closing price. You can witness a 'gap up' or a 'gap down.' A gap-up indicates that a lot of buyers are willing to purchase the stock at a price higher than the previous day's close. It shows buyers' enthusiasm and strength, translating into a bullish sentiment. Let us understand this with a simple illustration. Let's say the closing price of XYZ stock was Rs. 95. The company announces some highly positive news after closing that day. The news is so good that the buyers rush to buy the stock at a much higher price the next day. Let's say this enthusiasm makes the stock price jump up to Rs 100. Despite no trading between Rs 95 and Rs 100, the stock price jumped to Rs 100.
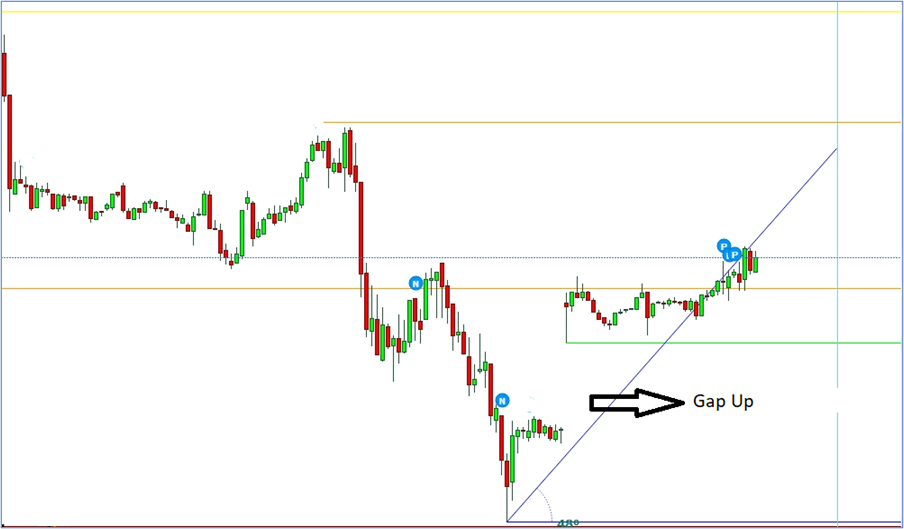
Similarly, a gap down shows the seller’s enthusiasm. The bears sometimes are so eager to sell and get rid of their holdings that they rush to sell the stock at a price lower than the previous day’s closing. Let us understand this with a simple illustration. Say the closing price of a particular stock is Rs 100. A sudden, unexpected bad news about the company is made public after the market closing hours. There is a panic; the next day, the stock opens at Rs 95. There is a clear drop in the prices despite no trading between the closing price of Rs 100 and the next day’s opening price of Rs 95.
Doji
Also, we need to understand another candlestick pattern here called ‘The Doji.’ Doji is a candlestick pattern in technical analysis that can be observed when the opening and closing prices of an asset are almost equal, resulting in a very small or nonexistent body, and a long wick on either side. This pattern signals indecision in the market, as buyers and sellers struggle to gain control.
Did you know?
In Japanese, ‘Doji’ means ‘the same thing’. It refers to a rare situation where the opening and the closing prices are the same or very close. Doji’s are rare and neutral in nature. On their own, they do not convey much. But are used with other candles to predict reversals.
Here are some different types of Doji patterns, each with its unique characteristics:
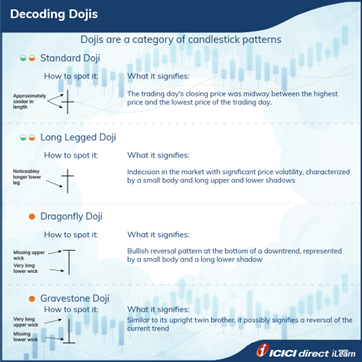
Standard Doji:
This is the most basic type of Doji, and it occurs when the opening and closing prices are nearly equal. The long wicks on both sides of the candlestick indicate significant volatility during the trading session. Like all Dojis, a standard Doji is a neutral pattern signifying indecision in the market.
Long-Legged Doji:
This type of Doji has very long wicks on both sides, indicating even more volatility than the standard Doji. The opening and closing prices are still close together, but the long wicks suggest that the market is undecided.
Dragonfly Doji:
This Doji has a long lower wick and little or no upper wick, creating a shape similar to a dragonfly. This pattern indicates that sellers were in control during the trading session, but buyers stepped in and drove the price back up.
Gravestone Doji:
This Doji has a long upper wick and little or no lower wick, creating a shape similar to a gravestone. This pattern indicates buyers were in control during the trading session, but sellers stepped in and drove the price back down.
Traders often use Doji patterns to signal potential trend reversals or continuation. A Doji alone does not provide a strong trading signal. Still, when it is combined with other technical indicators, such as support and resistance levels or trend lines, it can be a powerful tool for predicting future price movements.
Three candle patterns
Now let us look at some three candle patterns. Three-candle patterns are also known as multiple-candle patterns. Let us understand some of them.
Morning Star
Morning star is a bullish candle pattern evolving over three trading sessions. It indicates the reversal of a downtrend. It would be best to look at the candlesticks formed over three days to identify the morning star. As this pattern indicates the reversal in the downtrend, this appears at the bottom of a downtrend. Three candles make up the pattern, often consisting of a long bearish candle, a short bullish or bearish Doji, and a long bullish candle. Most traders seek for the top of the third candle to be halfway up the body of the first candle in the pattern to have a genuine Morning Star formation.
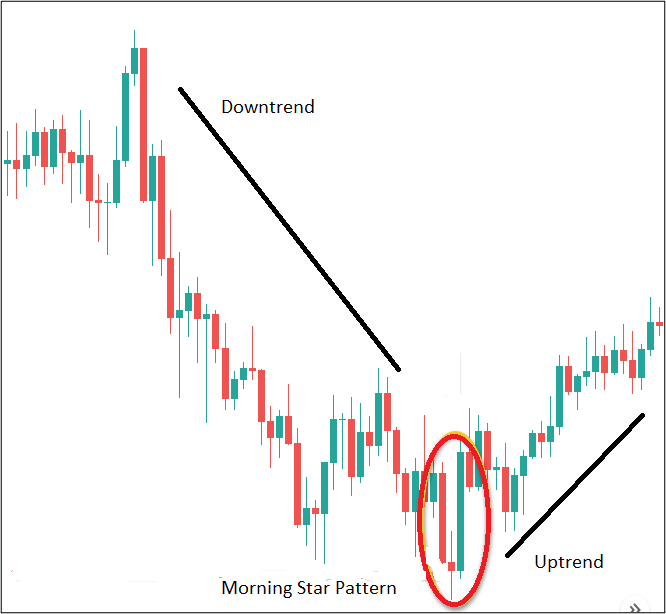
Let us understand the rationale behind this pattern formation. Bears are persistent, and robust and intense selling pressure is seen. This is confirmed with a long red/dark candle on Day 1 of the pattern formation. There is a gap down on Day 2. On Day 2, a Doji (we look at Doji in this chapter itself) forms that indicate indecisiveness. There is a gap on Day 3 of the pattern, and a light / hollow candle is formed, which closes above the closing of the candle formed on Day 1.
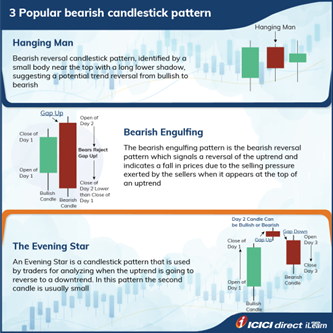
Evening Star
The evening star candlestick pattern is precisely the opposite of the morning star pattern. The evening star is a bearish candle pattern evolving over three trading sessions. It indicates the reversal of an uptrend. It would be best to look at the candlesticks formed over three days to identify the evening star. As this pattern suggests a reversal of an uptrend, it appears at the top. The three candles are a long bullish candle on day 1 of the pattern formation, followed by a small candle on day 2. The candle formed on day 3 is bearish.
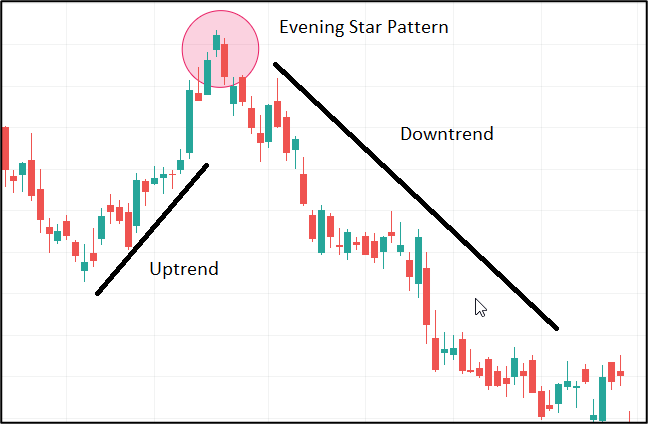
As a trader, you go short once you identify the evening star pattern. Let us understand the rationale behind this pattern. The stock is hitting a new high, and the bulls are in absolute control over the stock. This leads to forming of a bullish candle at the top of the trend. This shows accelerated buying. On day 2, the market opens with a gap indicating bullishness. However, this bullishness is not sustained, and either a Doji or a spinning top is formed, indicating indecisiveness in the market. This creates panic among the bullish traders as they cannot push the prices higher. On day 3, the market opens with a gap down, indicating that the bears have taken control of the stock. This shows that the uptrend is over and the downtrend has begun.
This brings us to the end of this chapter. Let us quickly summarize our key learnings.
Summary
- A gap-up indicates that more buyers are ready to buy the stock at a higher price than the previous day's close.
- A gap-down indicates a scenario where the sellers are willing to dump and sell the stocks at a price lower than the previous day’s closing price.
- A Doji indicates indecision in the market. In other words, it suggests a stand-off between buyers and sellers in the market.
- Morning star is a bullish candle pattern evolving over three trading sessions, indicating a downtrend reversal.
- The evening star is a bearish candle pattern evolving over three trading sessions, indicating an uptrend reversal.
In the next chapter, we will learn more patterns like Tops & Bottoms, Cup & Handle and Triangles & Wedges. Sounds interesting; let’s move further.


Please Enter Email


COMMENT (0)