
Learning Modules Hide
Hide
- Chapter 1: Power of Combined Technical Indicators – Part 1
- Chapter 2: Power of Combined Technical Indicators – Part 2
- Chapter 3: Directional Movement System
- Chapter 4: Rate of Change Indicator (ROC)
- Chapter 5: Comparative Relative Strength Indicator
- Chapter 6: Types of Market Days – Part 1
- Chapter 7: Types of Market Days – Part 2
- Chapter 8: Pivot Points - Part 1
- Chapter 9: Pivot Points – Part 2
- Chapter 10: Value Area Trading – Part 1
- Chapter 11: Value Area Trading – Part 2
- Chapter 1: Introduction to Technical Analysis
- Chapter 2: Introduction to Charts and Chart Types
- Chapter 3: Trends, Support, and Resistances
- Chapter 4: Breakouts, Stops and Reversals
- Chapter 5: Fibonacci Retracements
- Chapter 6: Candlestick Patterns - One and Two Candle Patterns
- Chapter 7: Candlestick Patterns: Three Candle Patterns
- Chapter 8: Chart Patterns
- Chapter 9: Moving Averages and Crossovers
- Chapter 10: Price Volume Confirmation
- Chapter 11: Technical Indicators - Part 1: MACD and Stochastics
- Chapter 12: Technical Indicators - Part 2: Bollinger Bands and Relative Strength Index (RSI)
- Chapter 13: Do’s and Don’ts for Effective Trading Using Technical Analysis
Chapter 4: Breakouts, Stops and Reversals
How often has this happened with you or someone you know who trades regularly? You are holding a stock that is good from a long-term perspective. However, there is a sudden decline in the price, and you are wondering whether the price decline is long-term or a temporary market hiccup attributed to market noise. Many of us have sold our holdings only to see the price rise after a few days. This scenario is all too common and highly frustrating.
What if you can witness improvement in your performance if you correctly understand the concept of breakout and retracements?
What is a breakout?
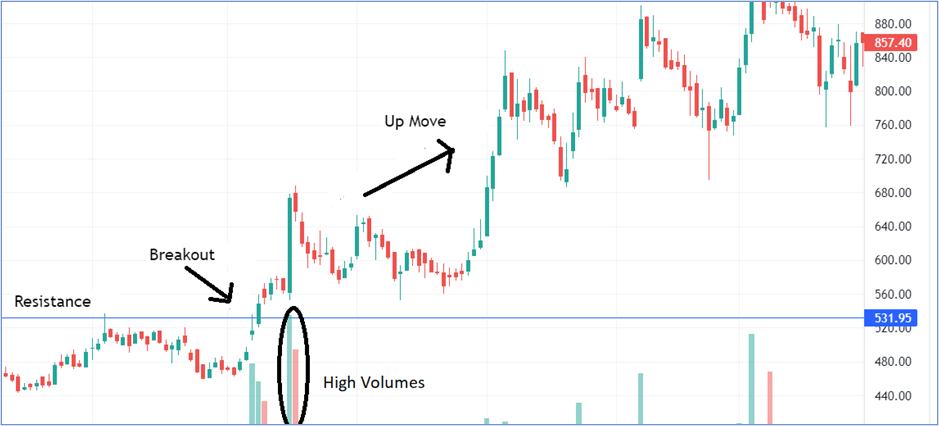
The concept of a breakout is closely connected with the twin concepts of support and resistance. (P.S. We have discussed the meanings of support and resistance in Chapter 3). In technical analysis, a breakout refers to a price movement of security that moves beyond a predefined level of support or resistance. This typically occurs when the price of a security has been trading in a narrow range for a prolonged period and then suddenly breaks out of that range, indicating a potential change in the direction of the price trend.
Breakouts can occur in either direction, either to the upside or the downside. An upside breakout occurs when the price of security breaks through a resistance level, while a downside breakout occurs when the price breaks through a support level. Traders and analysts often use breakout patterns as a signal to enter into a new position in the direction of the breakout. To confirm a breakout, traders often look for increasing trading volume, indicating significant buying or selling pressure behind the price move.
You should realize that breakouts can also be false signals, and it is essential to have proper risk management strategies in place to protect against potential losses. Therefore, traders should also use other technical indicators and analysis to confirm a breakout signal before entering a new trade. It is important to note that when the price breaks out through either the support or the resistance levels, traders waiting for the breakout to happen enter the market, and those who did not want the breakout to happen exit their positions to avoid potential losses.
What is the significance of a breakout?
A typical breakout occurs because the stock price has been restricted below a particular support and resistance level for quite some time now. You can use these support and resistance lines to set your entry points or stop loss levels. When the price breaks out through the support or resistance level, traders waiting for the breakout enter, and those who did not want the breakout to happen exit their positions to avoid losses.
This entry and exit of traders will often cause volumes to rise. The higher-than-usual volume will confirm the breakout. Low-volume breakouts are likelier to fail as they don’t interest the traders. Breakouts create different chart patterns like flags, wedges, triangles, and head and shoulders. (P.S. We will learn these patterns in more detail in the upcoming chapters). These patterns help traders to set up the trade, set stop loss levels, and even initiate or exit long and short positions.
Did you know?
We are talking about volumes a lot. What exactly do you mean by volume? It refers to the number of shares or contracts traded during a specific period. In technical analysis, volume analysis plays an important role. It primarily helps in understanding how other traders perceive the markets.
You should also know that a breakout can lead to a new 52-week high or low if the breakout happens very close to a prior high or low. But remember that not all 52-week highs and lows are due to a breakout.
What is Trading stops
In technical analysis, a stop-loss or stop-limit is an order placed with a broker that specifies a price level at which a trade should be closed to limit losses or secure profits. Placing trades based on stop loss or stop limit is to manage risk in trades by setting a predetermined exit point. A stop-loss order intends to close a trade once the market price reaches a specific level to limit losses. On the other hand, a stop-limit order is an order to trade a security once it reaches a specified price. This type of order can help traders enter or exit a trade at a specific price level, but it may only sometimes be executed if the market price reaches the specified level.
Traders often use technical analysis to determine where to place their stops based on support and resistance levels, trend lines, or other technical indicators. For example, a trader may place a stop-loss order below a key support level, which would trigger an automatic sale if the price falls below that level. This strategy helps limit losses if the market moves against the trader. Placing trades based on stops can help traders manage their risk and avoid emotional decision-making by removing the need for manual monitoring of the market. However, it is important to note that there is no foolproof way to manage risk, and traders should always be prepared for unexpected market moves that can cause their stops to be triggered. Therefore, a well-defined trading plan that considers risk management strategies and potential market scenarios are essential.
What are the Reversals in technical analysis?
In technical analysis, 'Reversals', 'Retracements', and 'Fibonacci Retracements' are concepts used to analyze market trends and identify potential support and resistance levels. A reversal occurs when a market trend changes direction, such as a bearish trend turning bullish or vice versa. Traders often look for reversal patterns on charts to identify potential changes in the trend and adjust their trading strategies accordingly.
Look at the following chart depicting a clear reversal.
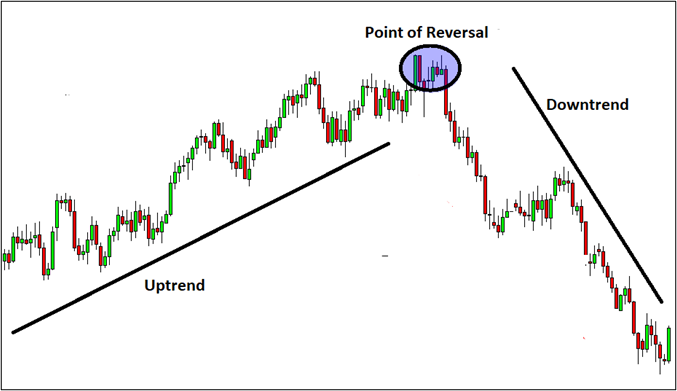
A retracement is a temporary reversal in the direction of a market trend. It occurs when the price of security pulls back from a previous high or low and then moves back in the direction of the overall trend. Traders often use retracements to identify potential support and resistance levels and determine where to enter or exit trades. In other words, retracement is that area of price movement that moves against the trend but returns to continue the trend.
Phew! This was quite intense. You came across many new technical analysis concepts. Let us quickly summarize and know our key takeaways from this chapter.
Summary
- A breakout refers to a market phenomenon where the price of a security moves above the resistance area or conversely moves below a support area.
- Breakout occurring on higher volumes than usual means the price is more likely to trend in the direction of the breakout.
- If you do not see good volume numbers, the price will not likely trend toward the breakout.
- Retracements are temporary reversals in security prices.
- A reversal refers to the market phenomenon where the underlying price trend of an asset reverses.
In the next chapter, we look at a very important and exciting topic – Fibonacci retracements, which identify possible retracement levels in stock charts.


Please Enter Email


COMMENT (0)