

Download
iLearn application
Elevate Your Financial Knowledge with the
ICICI Direct iLearn App


Candlestick charts are one of the most widely used tools in the stock market. They are essential for traders and investors to analyse price movements and make informed decisions. But what exactly is a candlestick in stock market, and how can it help you in trading? In this article, we will explore candlestick charts in detail and explain how to use candlesticks in trading effectively.
A candlestick is a graphical representation of price movements in a specific time period. It is part of a candlestick chart, which displays the highs, lows, opening, and closing prices of a stock or other financial instrument. Candlesticks were first developed in Japan over 300 years ago to analyse rice markets. Today, they are an integral part of modern technical analysis in trading.
To understand candlesticks, it is essential to know their key components:
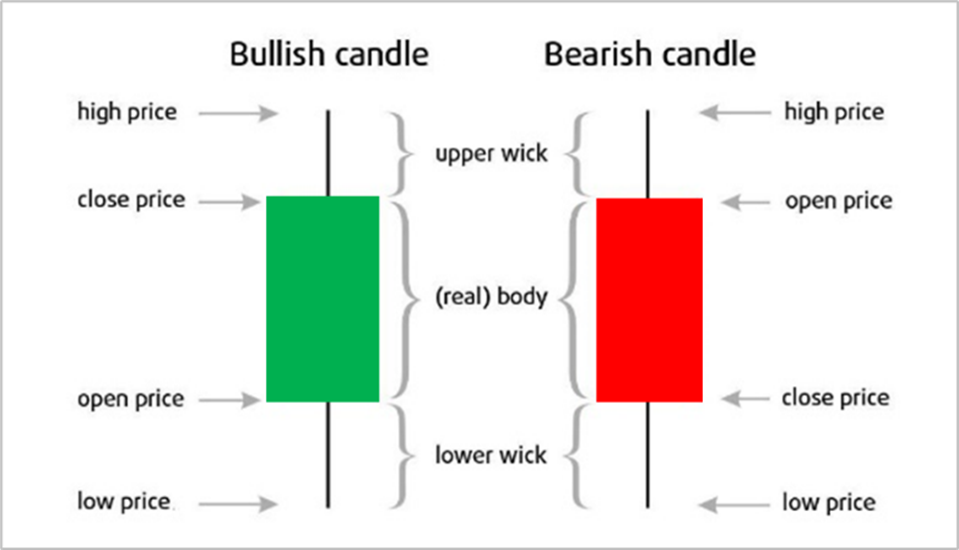
By understanding these components, you can interpret what each candlestick signifies in the stock market.
Read More: Different Types of Charts in Technical Analysis
Candlestick in stock market charts consist of multiple candlesticks that form patterns over time. These patterns provide insights into market sentiment and potential price movements.
Read More: How to Read Candlestick Chart Patterns
Candlestick in stock market offer several advantages over other charting methods, such as line charts or bar charts:
To begin with, it is essential to focus on the basics of candlestick charts by learning simple patterns like hammers and engulfing candles. These foundational patterns are easier to recognize and provide valuable insights into market trends and reversals. Practicing on demo accounts is another crucial step. Virtual trading platforms allow you to test your skills and strategies without risking real money, helping you gain confidence and refine your approach.
Continuous learning is also vital; regularly updating your knowledge about candlestick charts and trading strategies ensures you stay informed about new techniques and market conditions. Finally, it is important to avoid overtrading and relying solely on candlestick patterns. While these patterns are powerful tools, they should be used in conjunction with other analytical tools and indicators to make well-rounded trading decisions. This comprehensive approach will enhance your trading success and risk management.
When analysing candlestick patterns, it is crucial to avoid common mistakes that can undermine your trading decisions. One of the most significant errors is ignoring the broader market context. Focusing solely on candlestick patterns without considering the overall market trend can lead to inaccurate conclusions. Similarly, overlooking trading volume is another critical misstep, as volume provides essential confirmation of price movements and helps validate candlestick signals.
Using candlesticks in isolation is also a risky approach; always combine candlestick analysis with additional tools and indicators to ensure a more comprehensive understanding of market conditions. Lastly, failing to set a stop-loss is a common mistake that can result in substantial financial losses. Proper risk management, including setting stop-loss levels, is essential to protect your investments and minimize potential drawbacks. By addressing these pitfalls, you can enhance your ability to interpret candlestick charts effectively and make more informed trading decisions.
Understanding candlestick charts is a fundamental skill for anyone looking to succeed in the stock market. By learning what a candlestick is and how to use candlesticks in trading, you can gain valuable insights into market dynamics and improve your trading strategies. Remember to combine candlestick analysis with other tools and always keep learning to refine your skills.
Whether you are a beginner or an experienced trader, mastering candlestick charts can be a game-changer in your trading journey. So, start analysing candlestick patterns today and unlock the potential for smarter, more informed trading decisions.
Learn how to calculate the break-even point in commodity trading by factoring in brokerage, taxes, and other charges
Learn how ICICI Direct's Auto Order Slicing automatically splits large commodity orders for faster, seamless execution while complying with exchange limits.
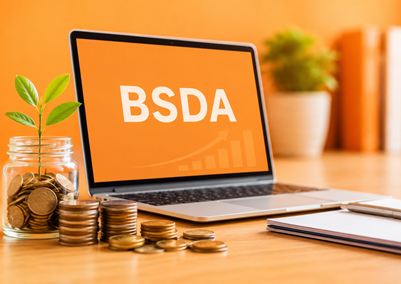
Learn about a BSDA account, its eligibility criteria, annual maintenance charges, and the latest SEBI rules for Basic Services Demat Accounts.


Elevate Your Financial Knowledge with the
ICICI Direct iLearn App
Elevate Your Financial Knowledge with the
ICICI Direct iLearn App
