
Download
iLearn application
Elevate Your Financial Knowledge with the
ICICI Direct iLearn App


Candlestick charts has been around for hundreds of years. They are often referred to as "Japanese candles" because the Japanese would use them to analyze the price of rice contracts. A rice trader named Homma from the town of Sakata deserves much of the credit for candlestick development and charting. Over many years of trading, it's likely that his original concepts were altered and improved, eventually leading to the candlestick charting system that we use today. But many of the guiding principles remained the same throughout the years:
Individual candlesticks can take a variety of forms, some have long bodies, some short wicks/shadows, some have short bodies with long wicks, and so on.
The colour of the body, the size of the wick and the body and where the candle sits relative to the wick tell a lot about the price action that occurs over the time period represented by the candlestick.
We can see how well even a single candlestick communicates the “market sentiment”: whether (and to what extent) bears or bulls were in control and how far traders managed to push prices in both directions.
Let us look at some of the candlestick patterns and their significance:
One-candlestick Patterns
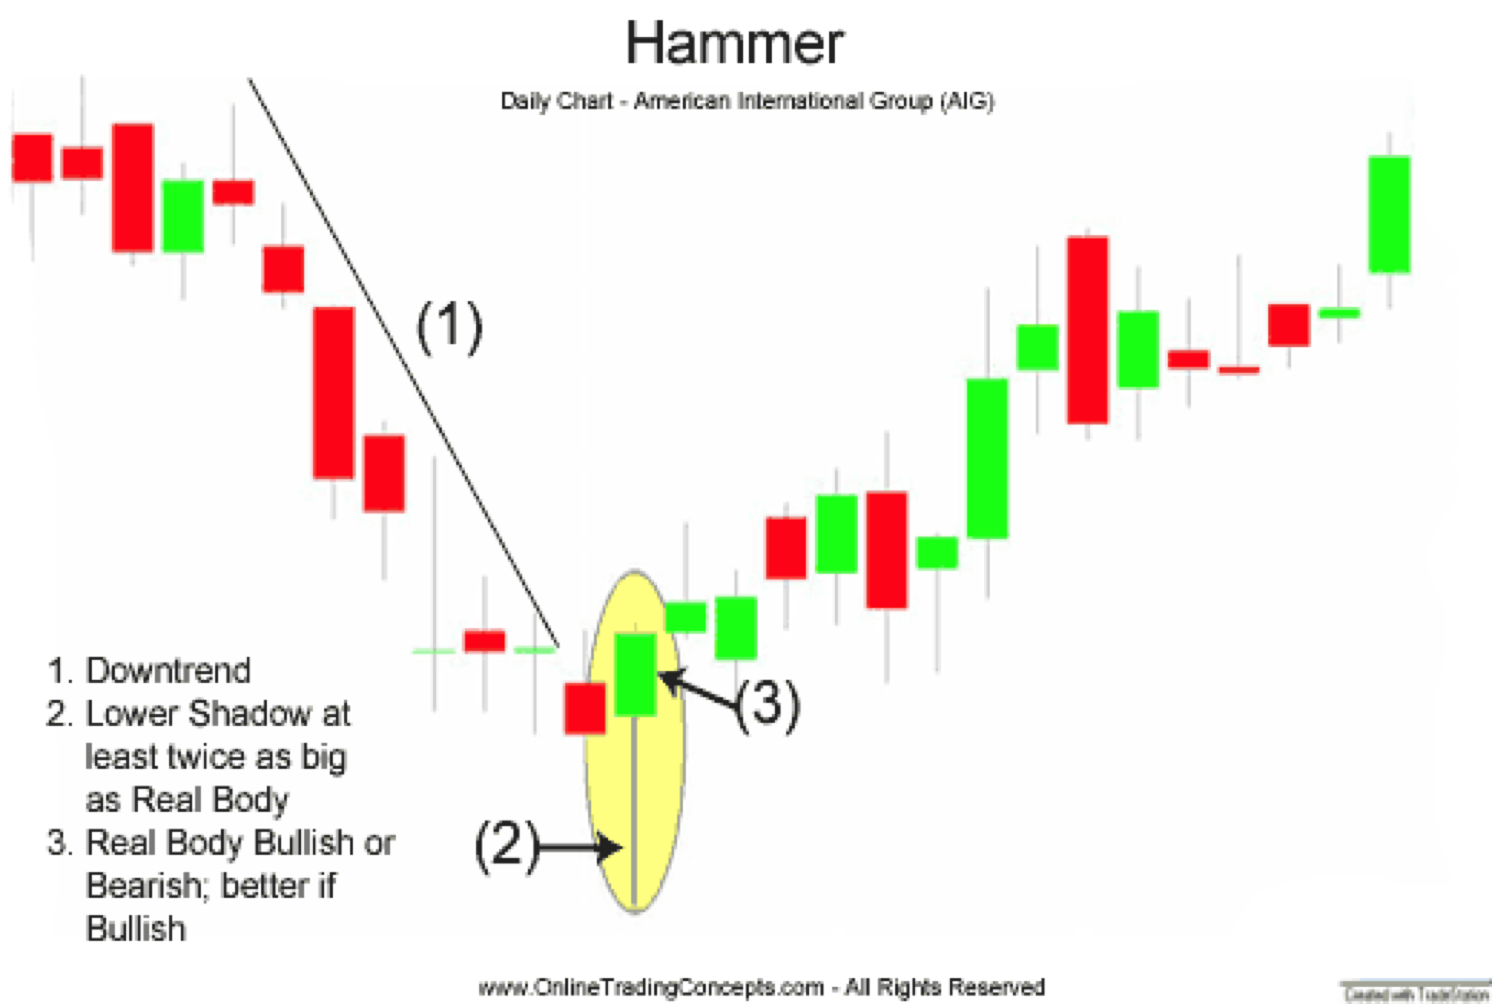
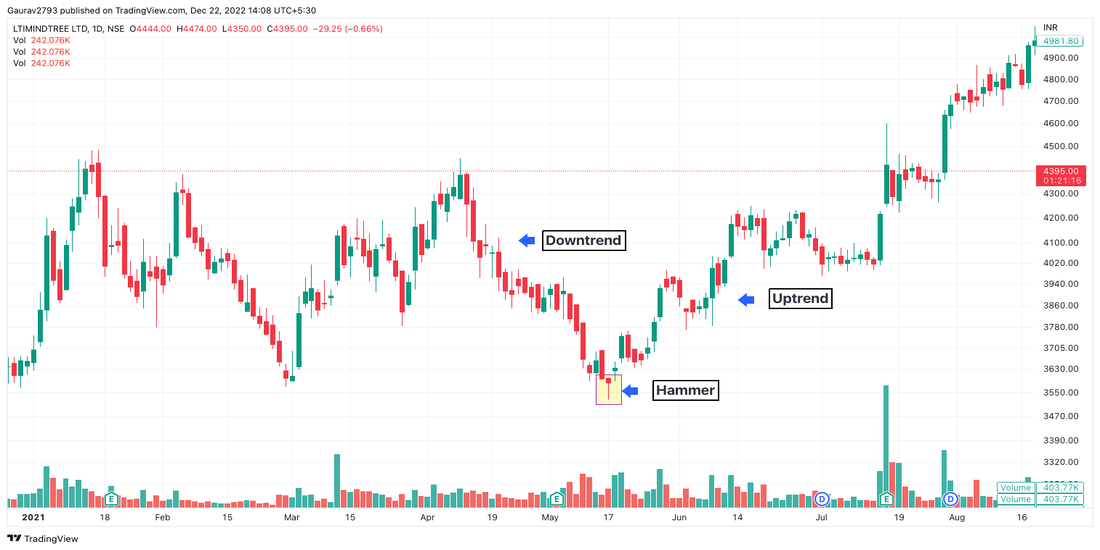
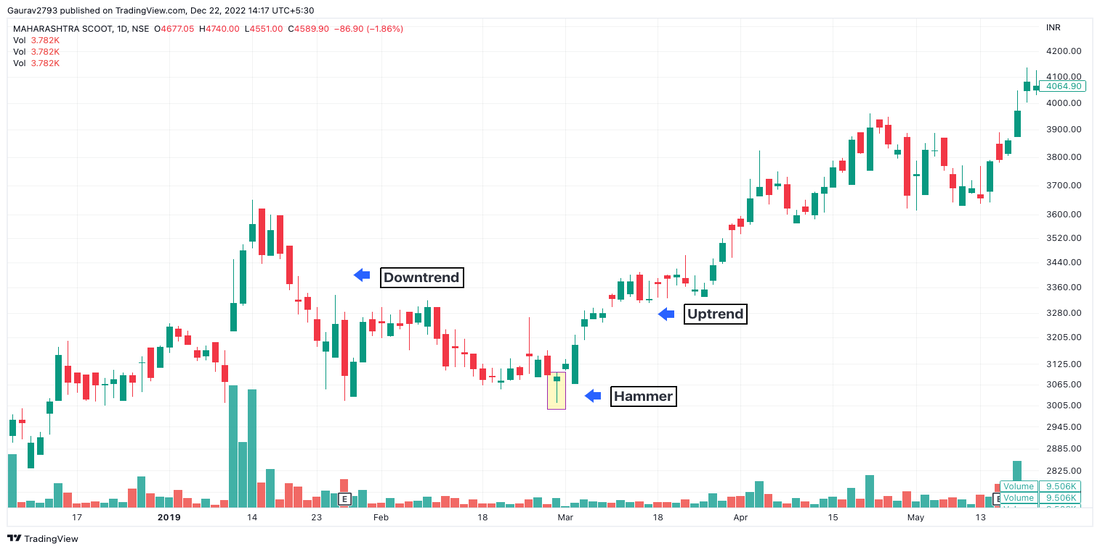
Hammer is a bullish trend reversal single candlestick pattern that forms after a decline in trend. Therefore, it indicates a change in trend, i.e. from a downtrend to an uptrend. It is so named because it hammers out the bottom. The resulting candlestick has a long lower wick with a short body and little to no upper wick.
Market view
The long lower wick's low suggests that sellers pushed prices lower throughout the session. The strong finish, on the other hand, suggests that buyers recovered to end the session strongly. Even though it might seem like enough to proceed, hammers need more bullish support. The low of the hammer indicates that there are still many sellers. Before taking action, there needs to be more buying pressure, ideally on an increasing volume. A gap up or a long green candlestick could provide such confirmation.
Criteria
Trade setup
The below examples are taken from the daily timeframe chart of LTI Mindtree and Maharashtra Scooter
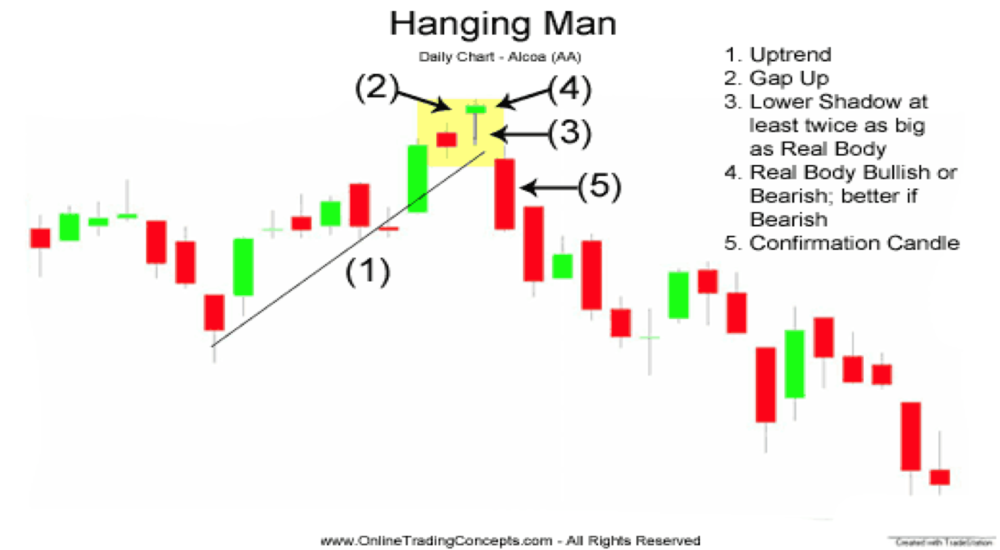
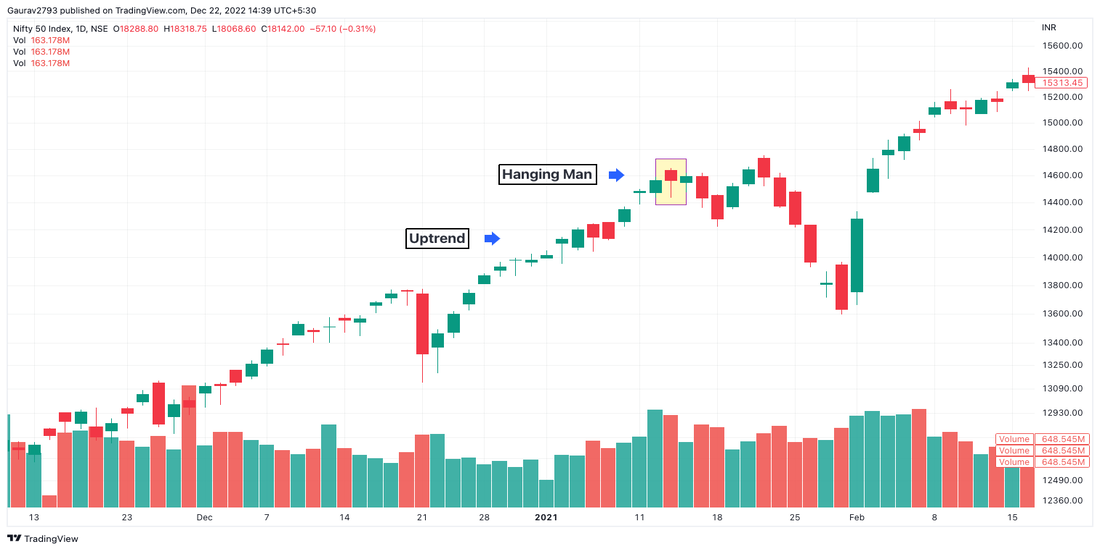
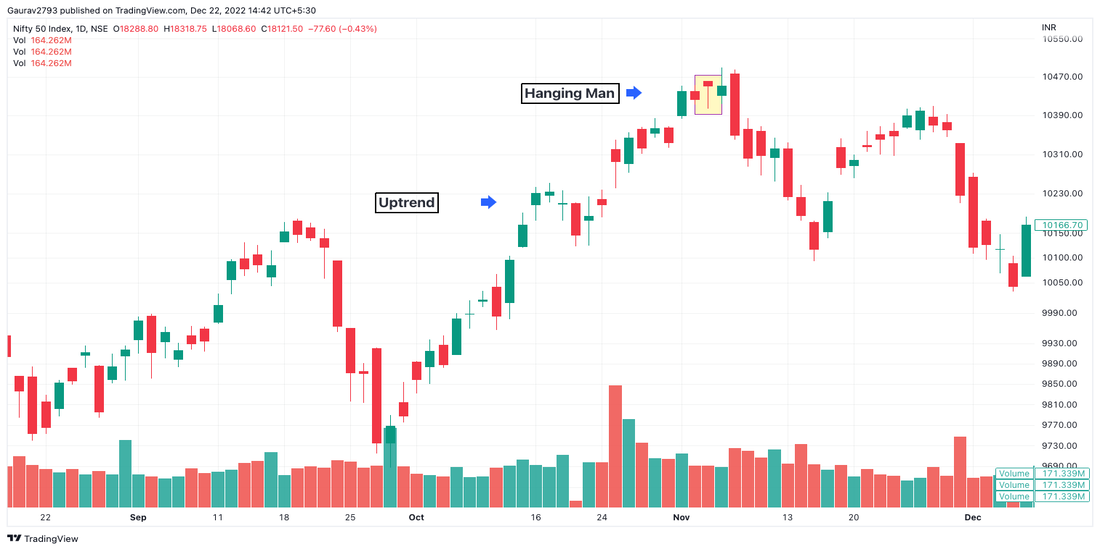
The "hanging man" pattern refers to a candle that has the same shape as a hammer, except that hammers occur in downtrends and the hanging man pattern occurs in uptrends.
Market view
The hanging man pattern is formed when bulls push prices higher at the open price of a trading session but bear then enter the market and push prices lower. The bulls eventually manage to push prices back up, but they can't maintain the momentum, and prices close near the open. This creates the small real body and long lower wick that characterizes the hanging man pattern.
The hanging man pattern is considered a bearish reversal pattern because it suggests that the bulls are losing control and bears are taking over. It is often interpreted as a signal that the uptrend is weakening and a downtrend may be starting.
Criteria
Trade setup
An "inverted hammer" is a bullish candlestick pattern that can potentially indicate a reversal in a downtrend. The candle has a small body, a long upper wick and a small or non-existent lower wick. This candlestick marks potential trend reversals but requires confirmation before action.

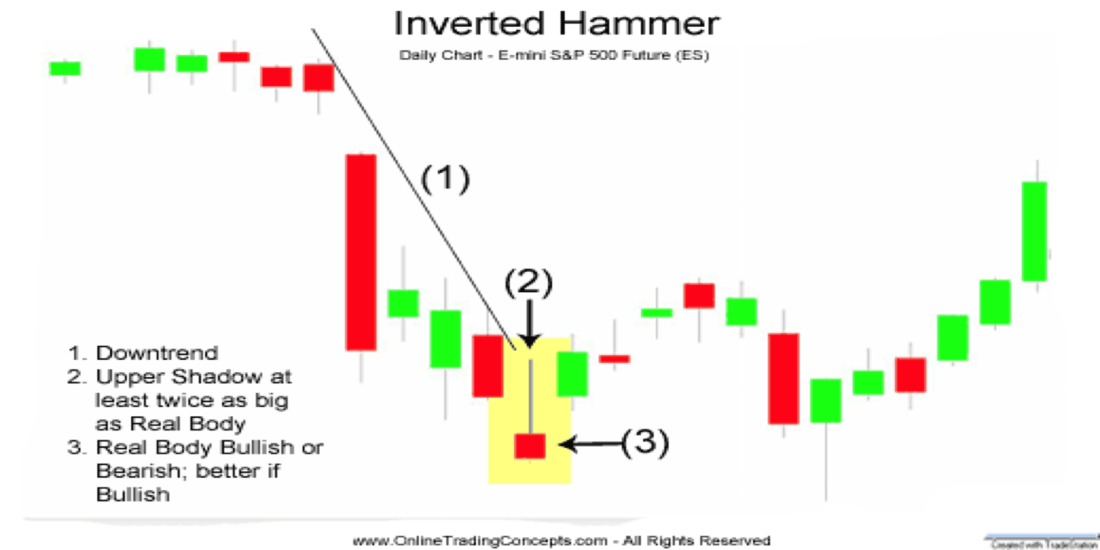
Market view
Inverted Hammers indicate a possible trend reversal or support levels. The long upper wick, which follows a decline, signals buying pressure during the session. The bulls, however, were unable to maintain this buying pressure, and prices closed substantially below their highs, resulting in a lengthy upper wick. This failure calls for bullish confirmation before taking any further action. Bullish confirmation could be provided by an Inverted Hammer supported by a gap-up or a long green candlestick with high volume.
Criteria
Trade setup
To read about candlesticks and technical analysis in detail, click here
Learn how to calculate the break-even point in commodity trading by factoring in brokerage, taxes, and other charges
Learn how ICICI Direct's Auto Order Slicing automatically splits large commodity orders for faster, seamless execution while complying with exchange limits.
Learn about a BSDA account, its eligibility criteria, annual maintenance charges, and the latest SEBI rules for Basic Services Demat Accounts.


Elevate Your Financial Knowledge with the
ICICI Direct iLearn App
Elevate Your Financial Knowledge with the
ICICI Direct iLearn App
