


-202610121017596081271.jpg)




Download
iLearn application
Elevate Your Financial Knowledge with the
ICICI Direct iLearn App




In the previous article, we discussed a bearish engulfing pattern. If you have already read that article, it would be easy to understand this one - Bullish Engulfing Pattern. This pattern signals a potential bullish reversal, and in this article, we will explore what it is, how it is formed, and how to use it to your advantage.
A bullish engulfing pattern is a two-candle candlestick pattern that signals the reversal of a downtrend and the start of a potential uptrend.
Let us look at the details of the two candles which form this pattern:
This pattern appears after a downtrend or a period of downward price movement, indicating that buying pressure is beginning to outweigh selling pressure, potentially leading to an upward price movement.
Let us look at how bullish engulfing patterns forms. To understand it, let us break down the two components:
Below are some strategies you use when you identify a bullish engulfing pattern:
Let us now take an example to understand the pattern with numbers. Suppose a stock has been in a steady downtrend, with prices falling from Rs 200 to Rs 120 over a few weeks. Assume one day, a small bearish candle forms at Rs 120, indicating continued selling pressure. However, the next day, a larger bullish candle opens at Rs 118 and closes at Rs 125, completely engulfing the previous day’s bearish candle. This pattern suggests that the downtrend might be ending, and an uptrend could begin. If you identify this pattern, you can decide to buy the stock, anticipating further upward movement.
Now that you understand both the patterns, it will be easy for you to understand the differences:
|
|
Bullish Engulfing Pattern |
Bearish Engulfing Pattern |
|
Market Trend |
Typically appears after a downtrend or a period of falling prices. |
Typically appears after an uptrend or a period of rising prices. |
|
Formation |
The first candle is bearish (red), followed by a larger bullish (green) candle that completely engulfs the body of the first candle. |
The first candle is bullish (green), followed by a larger bearish (red) candle that completely engulfs the body of the first candle. |
|
Psychological Implication |
Indicates that buyers are gaining control, suggesting a potential reversal from a downtrend to an uptrend. |
Indicates that sellers are gaining control, suggesting a potential reversal from an uptrend to a downtrend. |
|
Volume Consideration |
Higher volume on the bullish (engulfing) candle suggests stronger confirmation of a bullish reversal. |
Higher volume on the bearish (engulfing) candle suggests stronger confirmation of a bearish reversal. |
|
Trading Signal |
A signal to consider entering a long (buy) position due to potential upward movement. |
A signal to consider entering a short (sell) position due to potential downward movement. |
|
Location Importance |
More effective when found at the bottom of a downtrend or near significant support levels. |
More effective when found at the top of an uptrend or near significant resistance levels. |
The bullish engulfing pattern is an excellent tool for you if you are looking to identify potential reversals from bearish to bullish trends. While it provides valuable insights into market sentiment and potential price movements, the crucial takeaway is that it should not be used in isolation.
It would help if you considered using this pattern with other technical indicators, a broader market context, and robust risk management strategies to make more informed decisions and enhance trading outcomes.


Copper is a widely used base metal known for its electrical and thermal conductivity, strength, ductility and corrosion resistance. It is used across electrical wiring, construction, machinery, power infrastructure and several industrial applications.
 272 views
 2 minutes
 09 Oct 2026
Natural Gas is a widely traded energy commodity used for electricity generation, industrial activity, heating and other applications. Its prices can react sharply to weather, supply and demand, inventories, global energy markets and geopolitical developments.
473 views
1 minutes
30 Sep 2026
Gold is more than a precious metal. It is a safe-haven asset, investment avenue, central-bank reserve asset and industrial commodity. For a commodity trader, understanding both Gold's fundamentals and the contract being traded is important.
590 views
3 minutes
23 Sep 2026

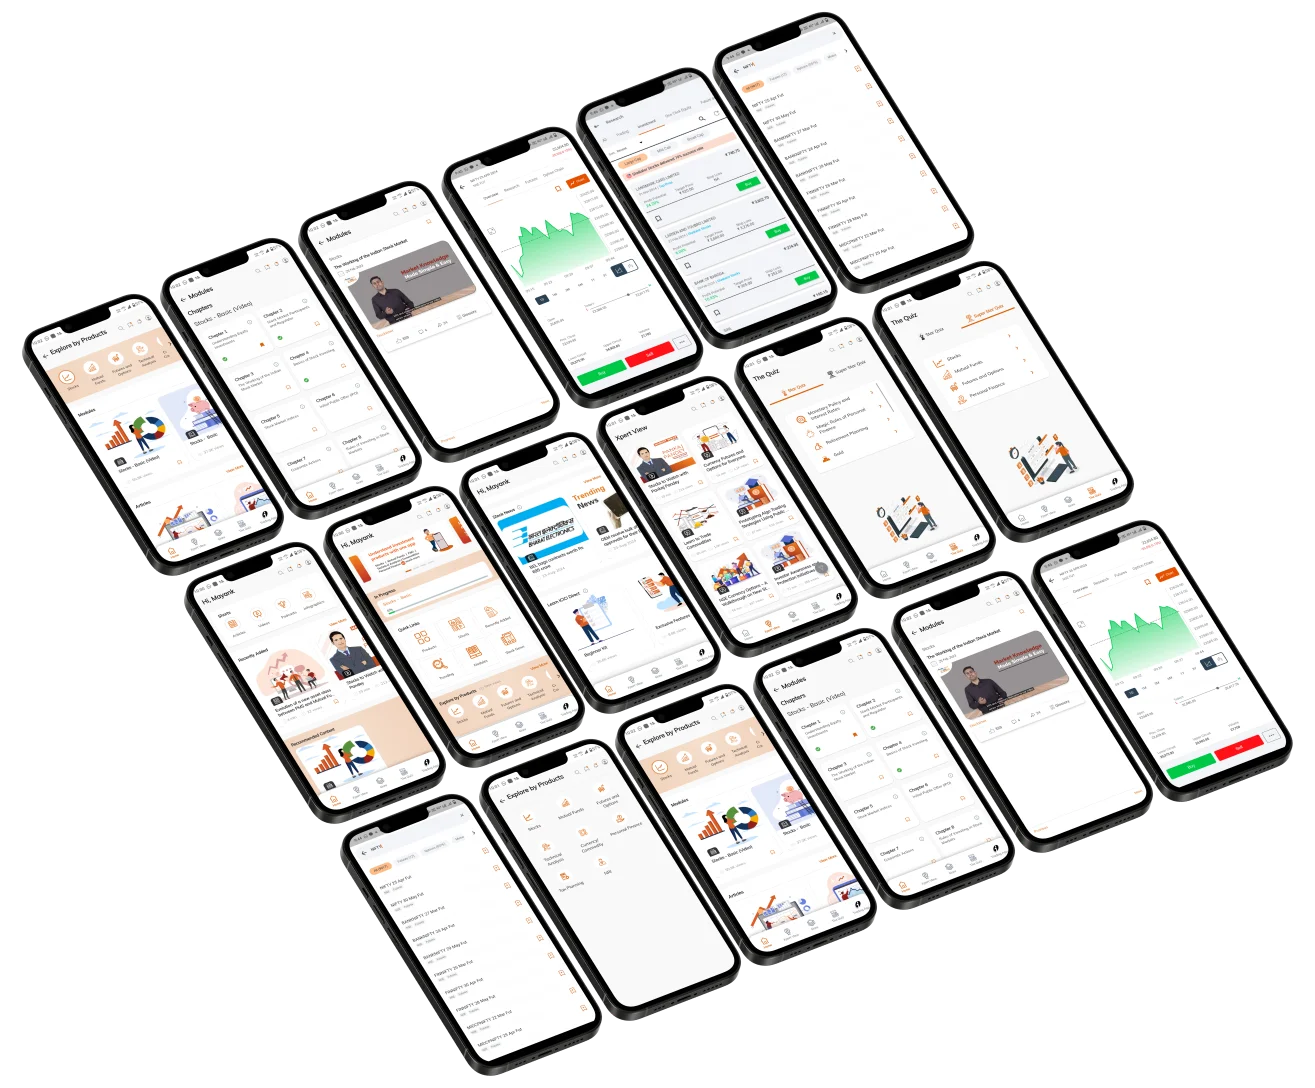
Elevate Your Financial Knowledge with the
ICICI Direct iLearn App
Elevate Your Financial Knowledge with the
ICICI Direct iLearn App
