


Download
iLearn application
Elevate Your Financial Knowledge with the
ICICI Direct iLearn App


Multiple Candlestick Patterns provide valuable insights into the market.
The Engulfing pattern is a bullish reversal pattern comprised of two candlesticks of opposite colours. Therefore, this is a bullish reversal pattern that is formed at the bottom of a downtrend. The pattern consists of a large green candle that engulfs a small red candle during a downtrend. It signifies that the buyers are taking over the sellers and a trend reversal is expected.

The pattern suggests an increase in activity from both bulls and bears as well as a turn in the market's overall sentiment in favour of the bulls. Thus, a bullish engulfing pattern in a downtrend indicates a trend change and the beginning of buyers overtaking sellers, which ultimately drives prices higher in an uptrend.
A bearish engulfing pattern is the opposite to the bullish engulfing pattern as it is formed when the bears get the better of the bulls. Therefore, this is a bearish reversal pattern that is formed at the top of an uptrend. This pattern consists of a small green candlestick with a short wick followed by a large red candlestick that engulfs the small green candle.
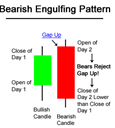
The pattern suggests an increase in activity from both bulls and bears as well as a turn in the market's overall sentiment in favour of the bears. A bearish engulfing pattern is most suggestive of the beginning of a bearish price move when it appears at the top of a primary uptrend.
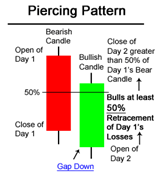
Piercing pattern is a bullish reversal pattern that can be seen at the end of a downtrend. The first candle of the pattern is a long bearish candle, representing the continuation of the downtrend, and the second candle opens lower than the previous close but then rallies up to close at least halfway up the previous candle.
The piercing pattern shows that the bulls are starting to take control and are pushing the prices higher, and it suggests that the selling pressure may have come to an end. The long lower wick of the second candlestick indicates that buyers have stepped in at the low of the previous candle and have been able to push prices back up. Therefore, piercing pattern shows that there is a sudden shift in market sentiment from bearish to bullish, and it could potentially indicate the end of a downtrend and the start of a new uptrend. The size and strength of the piercing candlestick can provide additional information about the market sentiment. A larger and more bullish piercing candlestick can suggest that there is more buying pressure and more conviction among buyers, while a smaller and weaker piercing candlestick may indicate a more cautious sentiment among buyers.
The Dark Cloud Cover pattern is the opposite of the Piercing candlestick pattern. It is a bearish reversal pattern occurring at the top of an uptrend. The first green candle is followed by a red candle that opens with a gap up and then closes at least halfway down the body of the preceding candle.
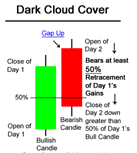
The pattern occurs at the end of an uptrend and signals a potential shift in market sentiment from bullish to bearish. It shows that the bears are starting to take control and are pushing prices lower. The long upper wick of the second candlestick indicates that sellers have stepped in at the high of the previous candle and have been able to push prices back down. The size and strength of the Dark Cloud Cover pattern can provide additional information about the market sentiment.
A candlestick that forms within the body of the previous candlestick is in a Harami position.
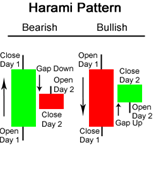
The harami pattern signifies that the immediately preceding trend may be concluding, and that the bulls and bears have called a truce. The harami pattern also suggests an impending rise in volatility. Due to this, traders now have the chance to set up trades that are based more on an increase in volatility than on a breakout in a particular direction.
For the best results as a reversal candle, look for the bearish harami to appear at the top of an upward retrace in a primary downward price trend. When price breaks out downward, it rejoins the existing primary trend and price tends to drop. The opposite is true for bullish harami pattern too.
A star is a candlestick that has a small body that lies outside of the range of the body before it. It implies an opening gap, and the second candlestick’s body does not overlap the previous candlestick’s body at all. It is similar to a doji in that it represents a sudden halt in a trend and some indecision between buyers and sellers.
In terms of market segments, a star pattern can indicate a potential shift in market sentiment from bearish to bullish or vice versa. If the star pattern forms after a prolonged downtrend, it may suggest that sellers are losing their grip on the market, and a potential reversal could be on the horizon. Conversely, if the star pattern forms after a prolonged uptrend, it may suggest that buyers are losing their grip on the market, and a potential reversal could be on the horizon.
Before the morning star pattern is formed, a downtrend has been in place which is assisted by a long red candlestick. The formation of the morning star signifies the weakness of the downtrend. After the first red candle of the morning start of formed, the next day prices gap lower on the open, trade within a small range and close near their open of the first candle. This small body shows the beginning of indecision. The third day prices gap higher on the open and then close much higher, indicating a significant reversal of the downtrend. This 3-candlestick pattern confirms that the bulls have started taking over the trend and a trend reversal is expected.
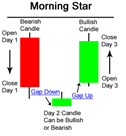
For the best performance from the morning star candlestick, look for it when the primary trend is rising. Then the morning star appears as part of a downward retrace of that uptrend. When an upward breakout occurs, price joins with the rising price trend already in existence and away the stock goes like a child's helium balloon untethered.
The Evening Star pattern is a bearish reversal signal. Again, like its name, the evening star pattern represents the dawn of a sunset, or simply the start of the trend in which the prices are going to decline. Therefore, the evening start is a top/bearish reversal pattern that occurs at the top of an uptrend. It is formed by a long green candle which extend the uptrend, a second candle with a small body that gaps above the first candlestick to form a “star” and a third long red candle that closes well into the first session’s green body.
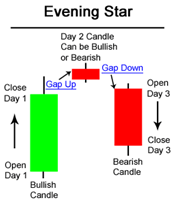
*Note: A gap indicates the space between the close of the previous candle and the open of the subsequent candle. Therefore, a gap up means the open of the second candle is above the close of the first candle. Similarly, a gap down means that the open of the second candle is below the close of the first candle.
Gold can react to inflation data, while crude oil may jump after an inventory report or geopolitical disruption.
Understand how crude oil trading works on MCX and also learn about contract sizes, expiry, trading hours, global benchmarks, price drivers and risks before you trade.
Learn how to calculate the break-even point in commodity trading by factoring in brokerage, taxes, and other charges


Elevate Your Financial Knowledge with the
ICICI Direct iLearn App
Elevate Your Financial Knowledge with the
ICICI Direct iLearn App
