







Download
iLearn application
Elevate Your Financial Knowledge with the
ICICI Direct iLearn App





The history of technical analysis of financial trends can be traced back for centuries. In Europe, Joseph de la Vega began observing the Dutch financial markets in the 17th century. The Candlestick pattern was developed in 18th century Japan by Homma Munehisa. In the early 20th century, Charles Dow observed the American stock market, which later led to the formulation of the Dow Theory. Richard W. Schabacker later continued Dow’s work. The book Technical Analysis of Stock Trends, now considered one of the seminal works in financial theory, was published by Robert D. Edwards and John Magee in 1948. George Lane developed the first accurate technical analysis indicator in the 1950s. Since then, there have been newer developments, including the RSI oscillator, that now play a central role in financial markets.
A derivatives oscillator is a trading indicator used to determine the market fluctuations of Derivatives. It is essentially a more advanced form of the relative strength indicator (RSI) that applies moving average convergence divergence (MACD) principles to a double smooth RSI. Constance Brown developed it in her book Technical Analysis for the Trading Professional.
The Derivatives oscillator is calculated in the following steps:
Limitations of the Derivatives oscillator are as follows:
The Derivatives oscillator resembles a formidable instrument for analysing financial trends. However, its reliance on past data and inability to account for the present-day makes it somewhat limited. Thus, traders may choose to work with more than one oscillator, combining the Derivatives oscillator with others for more sophisticated trend analytics. Ultimately, the Derivatives oscillator resembles a powerful analytical tool.


Gold can react to inflation data, while crude oil may jump after an inventory report or geopolitical disruption.
 493 views
 4 minutes
 21 Jul 2026
Understand how crude oil trading works on MCX and also learn about contract sizes, expiry, trading hours, global benchmarks, price drivers and risks before you trade.
697 views
2 minutes
20 Jul 2026
Learn how to calculate the break-even point in commodity trading by factoring in brokerage, taxes, and other charges
1 k views
1 minutes
01 Jul 2026
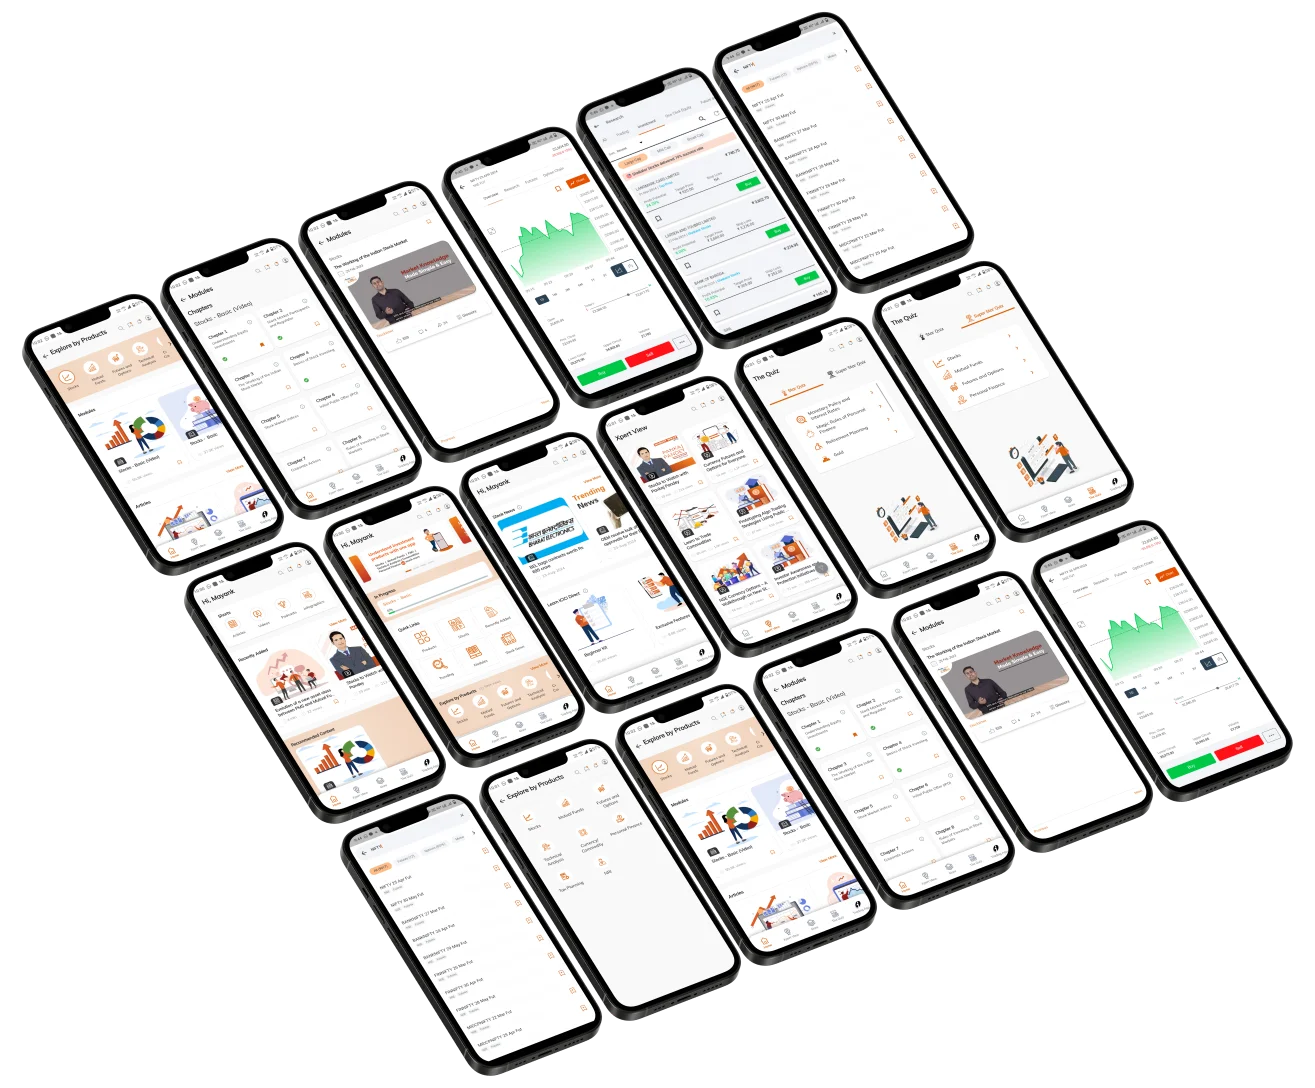
Elevate Your Financial Knowledge with the
ICICI Direct iLearn App
Elevate Your Financial Knowledge with the
ICICI Direct iLearn App
