
Download
iLearn application
Elevate Your Financial Knowledge with the
ICICI Direct iLearn App


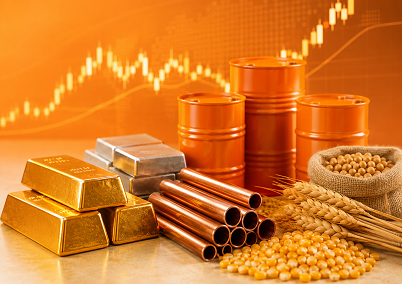
From supply disruptions and weather events to geopolitical developments, commodity prices move on a wide range of forces.
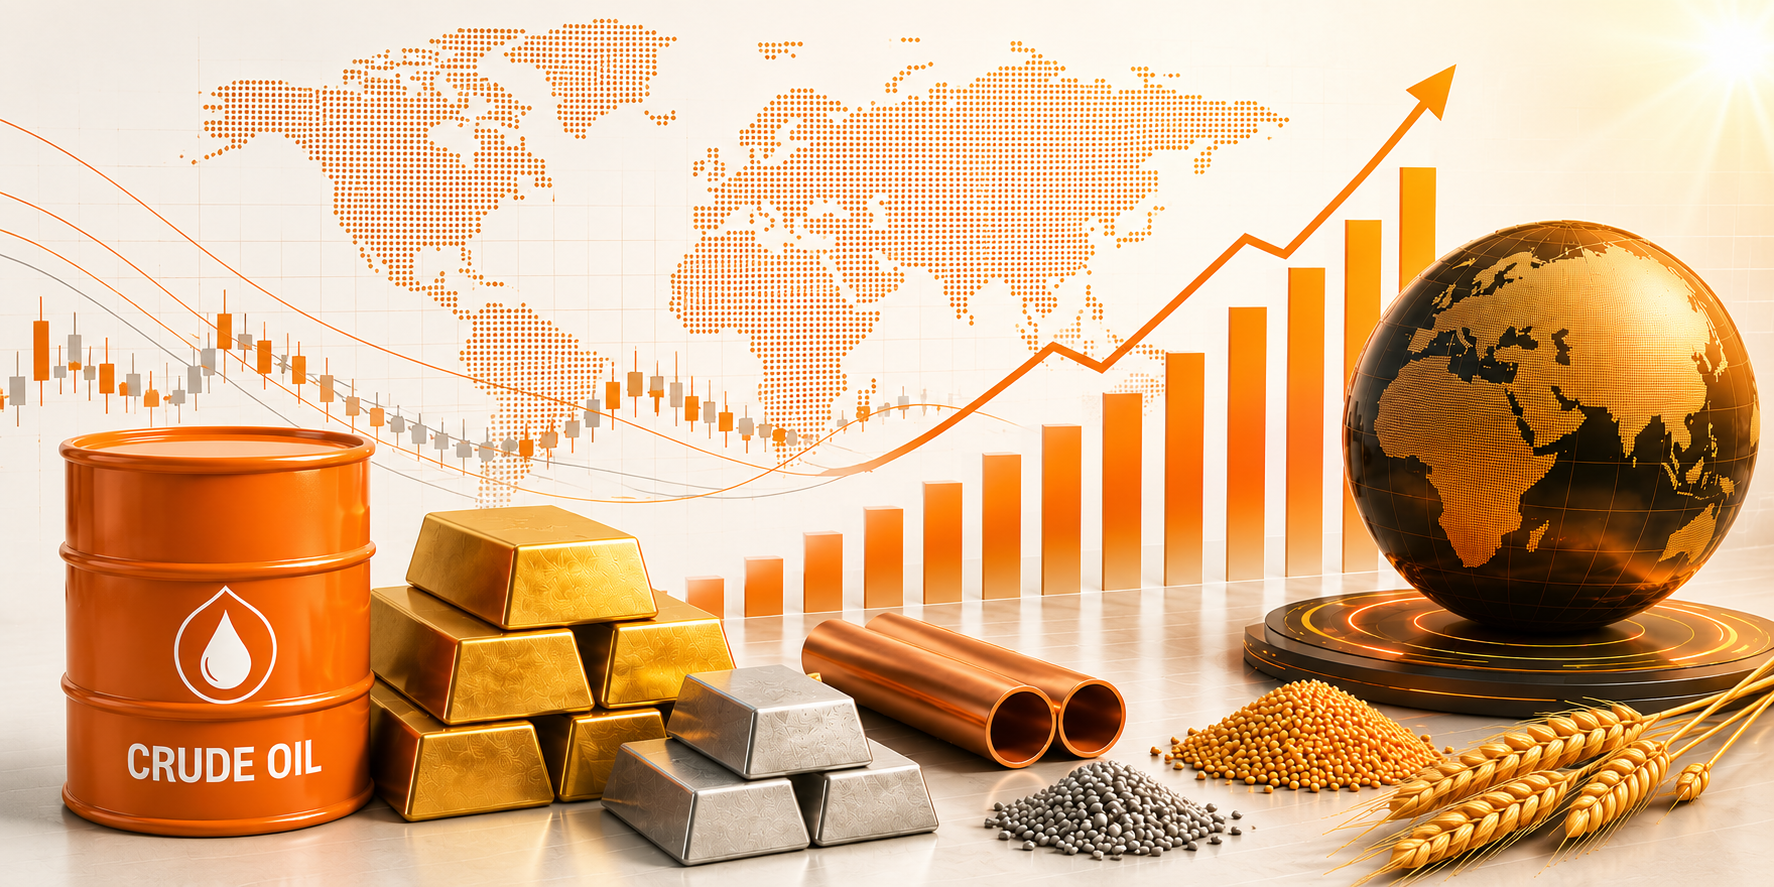
But the most consistent and forecastable price movements come from economic data. Indicators like GDP, growth, inflation, employment, and industrial output shape global demand for everything traded on MCX – gold, crude oil, copper, zinc, natural gas, etc.
For anyone trading on MCX, understanding which data points matter, when they are released, and how markets typically react can lead to better, more informed trading decisions.
Economic data helps market participants answer critical market questions, including:
The answers to these questions often influence commodity prices globally.
Watch Video: Key Economic Indicators Every MCX Trader Should Know| ICICI Direct
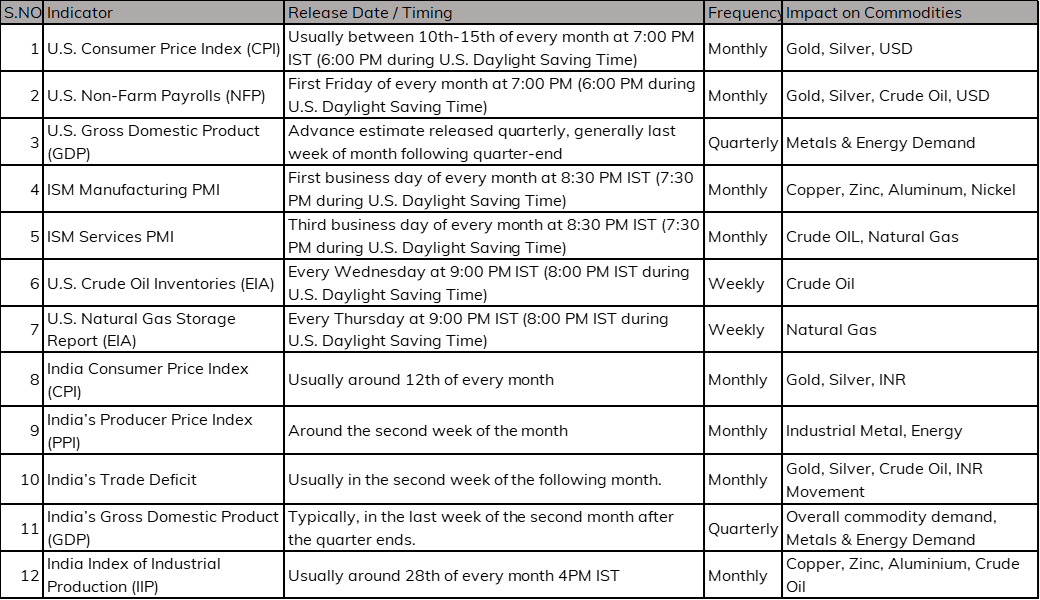
CPI is an index that tracks the average change in prices paid by consumers for a basket of everyday goods and services — the standard measure of retail inflation in the US.
Why It Matters: It helps gauge how fast the cost of living is rising and has a direct bearing on wages, savings, and monetary policy decisions.
How to Read: Rising CPI signals higher inflation, which can push up commodity prices — particularly for essentials like oil and food. It also raises the likelihood of interest rate hikes, which can strengthen the dollar and affect Gold prices.
It is one of the most market-moving economic releases globally. NFP is a monthly report covering job additions, unemployment, and wages across all non-agricultural sectors in the US.
Why It Matters: It is a reliable indicator of economic health and growth momentum.
How to Read: Low unemployment and rising wages signal stronger consumer demand, which typically supports commodity prices — particularly oil and industrial metals.
It’s the total value of all goods and services produced in the US over a given period — the broadest available measure of economic output.
Why It Matters: It is the most comprehensive indicator of economic health and industrial demand.
How to Read: Stronger GDP growth boosts demand for commodities across the board, while a slowdown or contraction tends to reduce it.
It’s a monthly survey of purchasing managers across US manufacturing firms, where a reading above 50 indicates expansion and below 50 signals contraction.
Why It Matters: It is closely watched as a leading indicator of economic activity, often moving ahead of official GDP data.
How to Read: An expanding index can drive up prices for metals and energy, as it reflects higher factory output and raw material consumption.
It’s a monthly survey measuring activity across US service industries, including healthcare, finance, and retail. A reading above 50 indicates expansion.
Why It Matters: The service sector accounts for the largest share of US economic output, making this a key gauge of overall economic momentum.
How to Read: Growth here indirectly supports commodity demand by reflecting a healthier, broader economy and higher energy consumption.
It’s a weekly report tracking changes in crude oil stockpiles held across US refineries and storage facilities.
Why It Matters: It reflects the prevailing supply-demand balance in the world's largest oil market, with direct implications for global crude prices.
How to Read: Rising inventories signal oversupply and can pull oil prices lower, while declining stockpiles suggest tighter supply and tend to push prices higher.
It’s a weekly report measuring changes in natural gas storage levels across the US.
Why It Matters: It provides a direct read on the supply-demand balance in energy markets and influences natural gas prices globally.
How to Read: Higher inventories tend to push natural gas prices down, while lower-than-expected storage levels — particularly during peak demand seasons — can drive prices up.
It’s a monthly index that tracks price changes across a basket of goods and services to measure retail inflation.
Why It Matters: It is the primary indicator of how fast the cost of living is rising and has a direct bearing on the RBI's monetary policy decisions.
How to Read: Rising CPI can lead to higher interest rates, which affect the rupee and, in turn, the domestic prices of imported commodities like oil and gold.
It measures price changes of goods at the wholesale level — an indicator of inflation at the production stage.
Why It Matters: It signals rising input costs for producers before they filter through to consumer prices.
How to Read: A higher WPI can indicate rising costs across the production chain, with implications for commodity prices in sectors like metals and energy.
It’s the difference between the value of India's imports and exports of goods and services in a given month.
Why It Matters: It reflects the country's trade balance and has a direct impact on the value of the rupee.
How to Read: A widening deficit can weaken the rupee, raising the domestic cost of imported commodities like crude oil and gold regardless of where global prices stand.
It’s the total value of goods and services produced within India over a given period — the most comprehensive measure of domestic economic output.
Why It Matters: It is the broadest indicator of economic health and industrial demand within the country.
How to Read: Stronger GDP growth signals higher demand for commodities like metals and oil, while a slowdown can soften domestic consumption and prices.
It’s a monthly index tracking output across the manufacturing, mining, and utilities sectors.
Why It Matters: It reflects the health of industrial activity and serves as a useful proxy for broader economic growth between GDP releases.
How to Read: A rising IIP points to stronger demand for industrial commodities like steel and energy, while a declining index can signal softening domestic consumption.
Economic indicators are not the only force that moves commodity prices, but they are among the most consistent and trackable.
For MCX traders, staying on top of these commodity data releases is a practical way to better understand price movements and make more informed trading decisions.
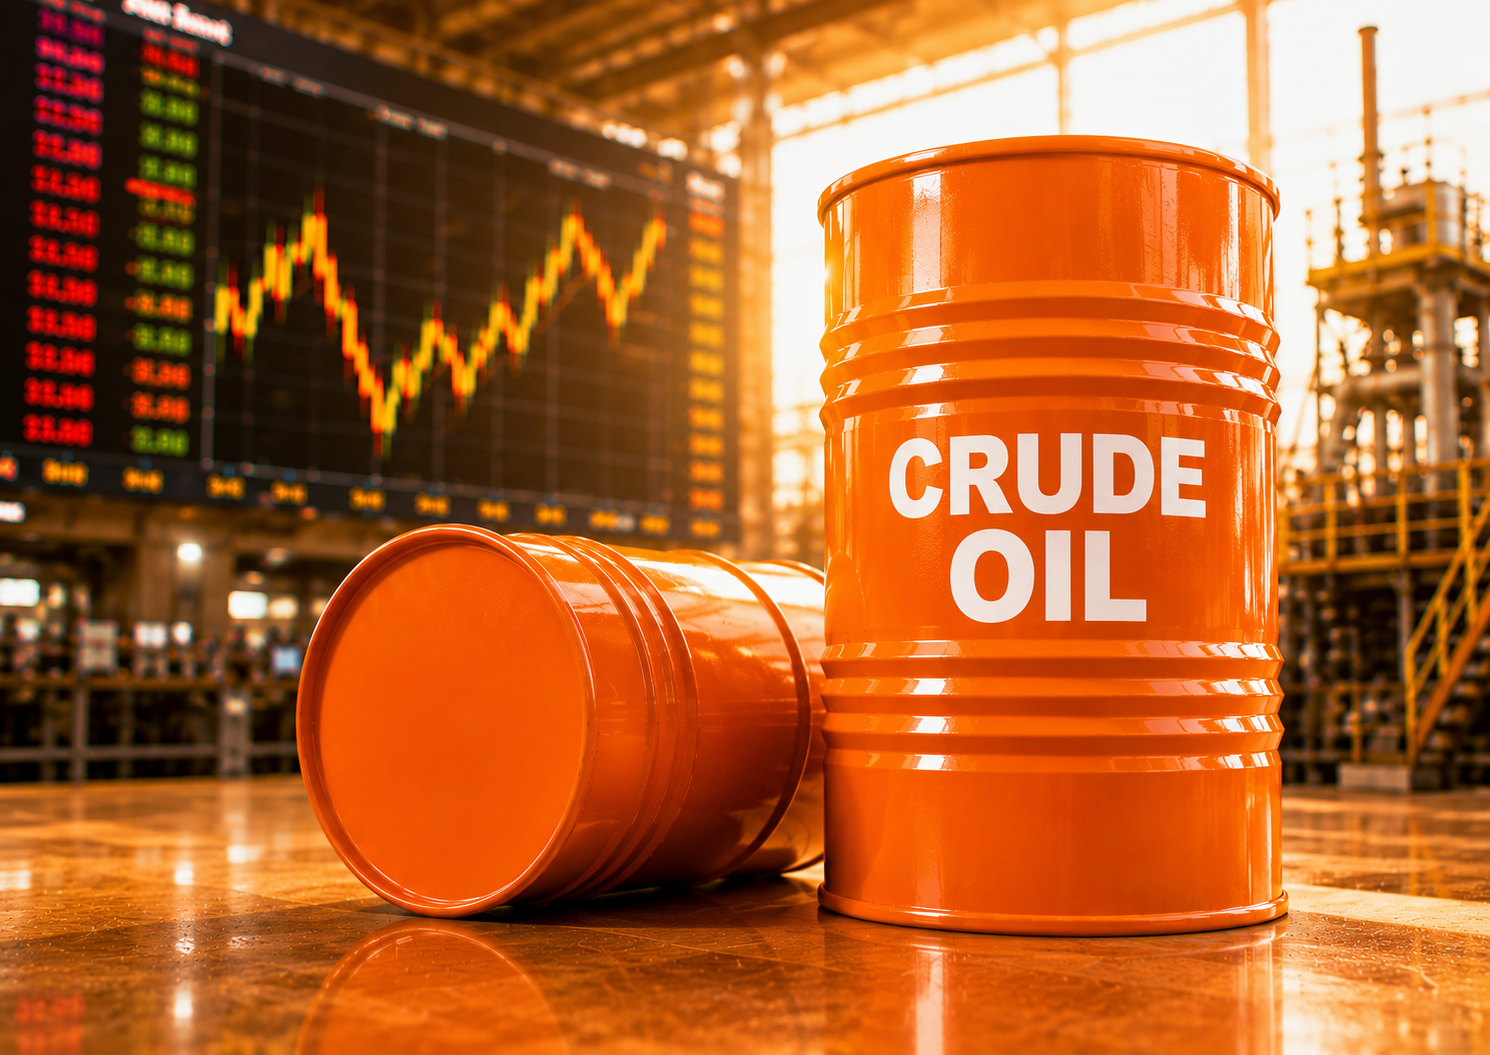
Gold can react to inflation data, while crude oil may jump after an inventory report or geopolitical disruption.
Understand how crude oil trading works on MCX and also learn about contract sizes, expiry, trading hours, global benchmarks, price drivers and risks before you trade.
Learn how to calculate the break-even point in commodity trading by factoring in brokerage, taxes, and other charges


Elevate Your Financial Knowledge with the
ICICI Direct iLearn App
Elevate Your Financial Knowledge with the
ICICI Direct iLearn App
