
Learning Modules Hide
Hide
- Chapter 1: Introduction to Mutual Funds
- Chapter 2 : Advantages of Mutual Funds
- Chapter 3 : Regulation and Structure of Mutual Funds
- Chapter 4 : Learn the Key Concepts of Mutual Funds: Part 1
- Chapter 5 : Learn the Key Concepts of Mutual Funds: Part 2
- Chapter 6: Types of Equity Mutual Funds
- Chapter 7 : Basics of Debt Mutual Funds (Part 1)
- Chapter 8 : Basics of Debt Mutual Funds (Part 2)
- Chapter 9 : Duration and Credit Ratings in Debt Mutual Funds
- Chapter 10 : Types of Debt Mutual Funds
- Chapter 11 : Exchange Traded Funds: Part 1
- Chapter 12 : Exchange Traded Funds: Part 2
- Chapter 13 : Hybrid/ Solution-oriented and other Mutual Funds Schemes
- Chapter 14: Mutual Fund Investment Choices - SIP
- Chapter 15: Mutual Fund Scheme Selection
- Chapter 1: Decoding the Mutual Fund Factsheet
- Chapter 2: Equity Mutual Funds: Evaluation (Part 1)
- Chapter 3: Equity Mutual Funds: Evaluation (Part 2)
- Chapter 4: Equity Mutual Funds – Evaluation (Part 3)
- Chapter 5: How to Choose the Right Debt Mutual Fund
- Chapter 6: Mutual Fund Investment Choices – Switch and STP
- Chapter 7: Mutual Fund Investment Choices – SWP and TIP
- Chapter 8: Mutual Fund Portfolio Management
- Chapter 9: Mutual Fund Return Calculations (Part 1)
- Chapter 10: Mutual Fund Return Calculations (Part 2)
Chapter 3: Equity Mutual Funds: Evaluation (Part 2)
You know you are healthy if certain aspects of your vitals are normal. Your blood sugar, heart rate, blood pressure and body temperature are some of those parameters. You would relax when these parameters are within a normal range. If the sugar level or blood pressure is outside the normal range, you may seek a course correction.
Just like your health, your investment through mutual funds can be evaluated through certain parameters. Based on your ability to withstand risk, you can make changes in your portfolio. This chapter will look into some important evaluation parameters related to the risk-reward ratios.
Sharpe ratio
Different schemes have different Sharpe ratios that are indicative of the portfolio’s risk and returns.
The Sharpe ratio compares the return earned over and above the risk-free return to the portfolio's total risk. Let’s put it in another way: the Sharpe ratio measures the excess return per unit of total risk. It helps compare the excess return you could earn for accepting higher volatility and risk from a mutual fund. The greater the Sharpe ratio, the more attractive the risk-adjusted returns are.
You already know two things about the total risk of a fund:
- It consists of both systematic and unsystematic risk.
- It is measured using standard deviation.
The risk-free return in this scenario is typically the return of a 91-day treasury bill.
You can calculate the Sharpe ratio by using the following formula:
Sharpe Ratio = (Portfolio Return – Risk-free Return)/Total Risk
When using the Sharpe ratio, you should only compare mutual fund schemes that have similar attributes. For example, you could:
- Compare funds that have a similar sectoral allocation.
- Compare schemes that invest in company stocks based on their market capitalisation. That means you could compare a mid-cap equity fund with other mutual funds that invest in mid-caps.
As an investor, look for mutual funds with a higher Sharpe ratio. These are likely to produce a better risk-adjusted return. The following example will illustrate why this happens:
|
Mutual Fund A |
Mutual Fund B |
|
|
Annual Return |
15% |
12% |
|
Risk-free Return |
6% |
6% |
|
Total Risk of the Portfolio (Standard Deviation) |
20% |
12% |
|
Sharpe Ratio |
(15% – 6%)/20% = 45% |
(12% – 6%)/12% = 50% |
|
|
|
Better risk-adjusted return |
The table above reveals two things:
- Fund B has a better risk-adjusted return.
- Based on returns alone, Fund A may seem to be a better choice. But the higher returns are due to the high risk taken by that fund.
Here are some tips for using the Sharpe ratio:
- Choose the fund category first.
- Identify the top-performing funds in that category based on their respective Sharpe ratios.
- The top-ranked fund might not always have the best risk-adjusted returns. Sometimes funds ranked second or third on the list may have a better risk-reward ratio.
- The Sharpe ratio does not make much sense on its own. You need to compare it with other similar schemes for it to make sense. As already mentioned before, a scheme with a high Sharpe ratio is considered good in comparison to other similar schemes.
- It does not give an indication about the portfolio risk and concentration in a particular sector. It only gives an indication of the total fund portfolio risk and returns.
Treynor ratio
The Treynor ratio compares the additional return earned over and above the risk-free return to the portfolio's market risk. In other words, it measures the excess return per unit of market risk.
You already know two things about the market risk of a fund:
- It is measured through beta.
- It covers only systematic risk.
Market risk is non-diversifiable. So, the Treynor ratio is best used for funds that
a) are fully diversified and
b) have zero or negligible unsystematic risk.
The return from a 91-day treasury bill is considered to be the risk-free return.
To calculate the Treynor ratio, use the following formula:
Treynor Ratio = (Portfolio Return – Risk-free Return)/Beta of a Fund
The Treynor ratio is useful for comparing mutual fund schemes based on their risk-adjusted returns. However, as with the Sharpe ratio, one should only compare mutual fund schemes that have similar attributes.
Keep in mind that funds with a higher Treynor ratio tend to produce better risk-adjusted returns. Here’s an example to explain this.
|
Mutual Fund A |
Mutual Fund B |
|
|
Annual Return |
15% |
12% |
|
Risk-free Return |
6% |
6% |
|
Fund Beta |
1.5 |
0.8 |
|
Treynor Ratio |
(15% – 6%)/1.5 = 6% |
(12% – 6%)/0.8 = 7.5% |
|
Better risk-adjusted return |
What does the above table tell us?
- Fund B has a better risk-adjusted return.
- Based on returns alone, Fund A seems to be the better choice. However, the higher returns are due to the high risk taken by the fund.
Here are some tips for using the Treynor ratio:
- As with the Sharpe ratio, begin by choosing the fund category first.
- Identify the top-performing funds based on the Treynor ratio.
- Don’t just go with the top-ranked fund. Often, funds that are ranked second or third have better risk-reward ratios.
- Treynor ratio is based on past performance of securities. As you may already know, past performance is not always an indicator of future performance. Changing market conditions are not taken into consideration in this ratio.
Did you know?
- Standard deviation can also be calculated by using a formula on an Excel spreadsheet.
For example: STDEV.P (10%,12%,15%,8%,15%) = 2.757%. - Standard deviation can also be calculated by using a formula on an Excel spreadsheet.
For example: STDEV.P (10%,12%,15%,8%,15%) = 2.757%.
Sortino ratio
What’s better than the Sharpe ratio for mutual fund investors? The Sortino ratio, of course! This is a modified version of the Sharpe ratio.
The Sharpe ratio uses standard deviation to measure risk. In this, it considers the deviation from the mean. The disadvantage is that it considers any deviation from the mean—whether upside or downside—as a risk.
Why is this a problem? From the investment perspective, only negative deviations are a real risk. That’s where the Sortino ratio has an edge. It considers only downside deviations as investment risk and excludes upside deviations from the calculations.
Here’s the formula for calculating the Sortino ratio:
Sortino Ratio = (Portfolio Return – Risk-free Return)/(Standard Deviation of Downside Risk)
Information ratio
Information ratio measures consistency in a fund's performance vis-à-vis the benchmark. The formula for calculating the information ratio is simple:
Information Ratio = (Fund Return – Benchmark Return)/(Tracking Error)
Here, the tracking error is the standard deviation of the difference between the fund’s returns and the benchmark’s returns.
As an investor, you should take note of the following:
- A low tracking error indicates that the fund has consistently beaten the benchmark.
- A higher numerator value shows the excess return of the fund in comparison to the benchmark.
- Here’s a tip! Look for a fund that has a higher information ratio. This suggests that the fund carries a lower risk and has consistently outperformed its benchmark.
Alpha ratio
The alpha ratio measures a fund's excess return in comparison to the risk taken. Also known as Jenson's alpha, this ratio is used to measure the performance of a fund manager.
A fund should offer a return equivalent to the return obtained by the Capital Asset Pricing Model (CAPM). The CAPM considers three things:
- the risk-free return,
- the market return, and
- the beta of a fund.
To calculate the fund return by using the CAPM method, simply use this formula:
Fund Return = Risk-free Return + {Beta *(Market Return – Risk-free Return)}
If the fund can beat the CAPM return, then it has a positive alpha.
Here’s a tip! You, as an investor, should look for schemes with a high positive alpha. As a general rule, the higher the positive alpha, the better is the fund.
Here’s an example to explain how the alpha ratio works:
Sagnik is looking to invest in Fund ABC. Here’s what he knows about the fund:
- Fund ABC has a beta of 1.2.
- Market return is 12% per annum.
- Risk-free return in the market is 6% per annum.
Sagnik can use this information to calculate the fund’s CAPM return:
CAPM Return = 6% + {1.2*(12% – 6%)} = 13.2%
Now, Sagnik must check if the fund offers a yearly return of more than 13.2%. If the fund does offer a higher return, then that means it has a positive alpha. The excess returns generated by such a fund would be due to the fund manager's skills.
Sagnik learns that Fund ABC offers returns of 15% per annum. That means its alpha is 15% –13.2% = 1.8%. He decides to invest in the fund because of the higher positive alpha.
Summary
-
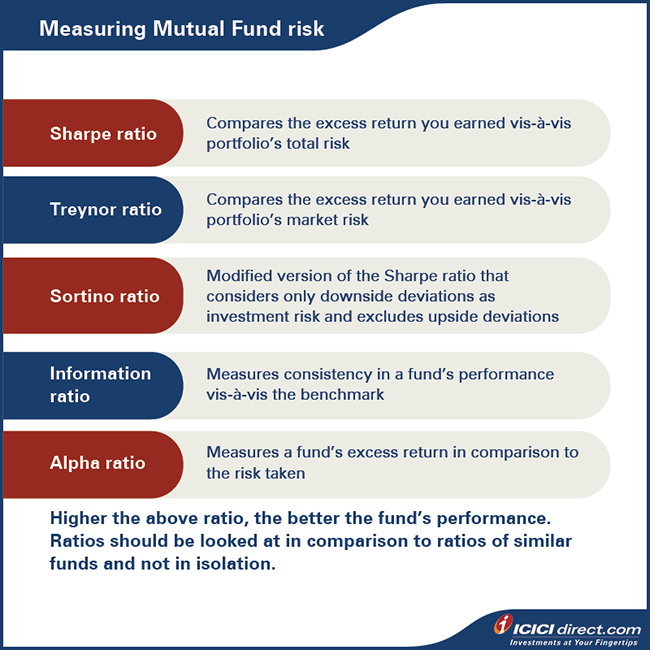
- The Sharpe ratio compares the return earned over and above the risk-free return to the portfolio's total risk.
- Sharpe Ratio = (Portfolio Return – Risk-free Return)/Total Risk
- The Treynor ratio compares the additional return earned over and above the risk-free return to the portfolio's market risk.
- Treynor Ratio = (Portfolio Return – Risk-free Return)/Beta of a Fund
- The Sortino ratio is a modified version of the Sharpe ratio that considers only downside deviations as investment risk and excludes upside deviations from the calculations.
- Sortino Ratio = (Portfolio Return – Risk-free Return)/(Standard Deviation of Downside Risk)
- Information ratio measures consistency in a fund's performance vis-à-vis the benchmark.
- Information Ratio = (Fund Return – Benchmark Return)/(Tracking Error)
- Tracking error is the standard deviation of the difference between the fund’s returns and the benchmark’s returns.
- The alpha ratio measures a fund's excess return in comparison to the risk taken.
- Fund Return = Risk-free Return + {Beta *(Market Return – Risk-free Return)}
- The Sharpe ratio compares the return earned over and above the risk-free return to the portfolio's total risk.
This a wrap-up of the different metrics you need to evaluate equity mutual funds. Next, we will see how to put all of these together to evaluate the risk further and choose the right mutual fund.


Please Enter Email


COMMENT (0)