
Learning Modules Hide
Hide
- Chapter 1: Introduction to Mutual Funds
- Chapter 2 : Advantages of Mutual Funds
- Chapter 3 : Regulation and Structure of Mutual Funds
- Chapter 4 : Learn the Key Concepts of Mutual Funds: Part 1
- Chapter 5 : Learn the Key Concepts of Mutual Funds: Part 2
- Chapter 6: Types of Equity Mutual Funds
- Chapter 7 : Basics of Debt Mutual Funds (Part 1)
- Chapter 8 : Basics of Debt Mutual Funds (Part 2)
- Chapter 9 : Duration and Credit Ratings in Debt Mutual Funds
- Chapter 10 : Types of Debt Mutual Funds
- Chapter 11 : Exchange Traded Funds: Part 1
- Chapter 12 : Exchange Traded Funds: Part 2
- Chapter 13 : Hybrid/ Solution-oriented and other Mutual Funds Schemes
- Chapter 14: Mutual Fund Investment Choices - SIP
- Chapter 15: Mutual Fund Scheme Selection
- Chapter 1: Decoding the Mutual Fund Factsheet
- Chapter 2: Equity Mutual Funds: Evaluation (Part 1)
- Chapter 3: Equity Mutual Funds: Evaluation (Part 2)
- Chapter 4: Equity Mutual Funds – Evaluation (Part 3)
- Chapter 5: How to Choose the Right Debt Mutual Fund
- Chapter 6: Mutual Fund Investment Choices – Switch and STP
- Chapter 7: Mutual Fund Investment Choices – SWP and TIP
- Chapter 8: Mutual Fund Portfolio Management
- Chapter 9: Mutual Fund Return Calculations (Part 1)
- Chapter 10: Mutual Fund Return Calculations (Part 2)
Chapter 2: Equity Mutual Funds: Evaluation (Part 1)
Atul goes through the fund factsheet of different mutual fund schemes he has received. But he’s confused on how to pick the fund that works for him. This brings up the question: how does anyone find the right scheme?
When choosing an equity mutual fund, the investor has to examine two key factors:
- The risk involved
- The potential for returns
For instance, let’s say you have a high risk-taking appetite. That means you can manage with high volatility but also want higher returns. In such a scenario, an equity mutual fund scheme could meet your desired expectation. But, the performance of an equity mutual fund cannot be assessed based on risk and return alone. To do it right, investors must also consider the third factor:
- The risk-reward ratio
Measures like the Sharpe ratio, the Treynor ratio, and the Sortino ratio help evaluate the risk-reward ratio of a fund. Want to measure the fund manager’s performance? Jenson's Alpha can help. Checking how consistently a fund performs in comparison to its benchmark index? Use the information ratio in your assessment.
Like Abhishek, are you too looking for the right equity mutual fund? If so, the first step is understanding the various measures and risk parameters in detail.
Standard Deviation and Beta
In simple terms, risk is the probability of loss or uncertainty of outcome. What does it mean if you are investing in the equity market? Here, the return on equity investment is uncertain, and that uncertainty is known as risk.In the context of equity investments, risk can be classified into two parts: systematic risk and unsystematic risk.
Systematic risk:
Also known as market risk, this is measured through an indicator known as beta. Systematic risk affects the overall market. It is neither sector-specific nor related to any specific company. However, it may have different impacts on various sectors and companies. Interest rates, inflation, and economic and political risk are examples of systematic risk. These risks cannot be reduced by diversification. This is why systematic risk also goes by another name: non-diversifiable risk.
Unsystematic risk:
This is a company- or sector-specific risk. That means it has impacts on only particular companies or sectors.Credit risk, management risk, and operational risk are examples of unsystematic risk. These risks can be reduced with the help of diversification. This is why systematic risk is also referred to as diversifiable risk.
The graph below will give you an idea of how systematic and unsystematic risk work.
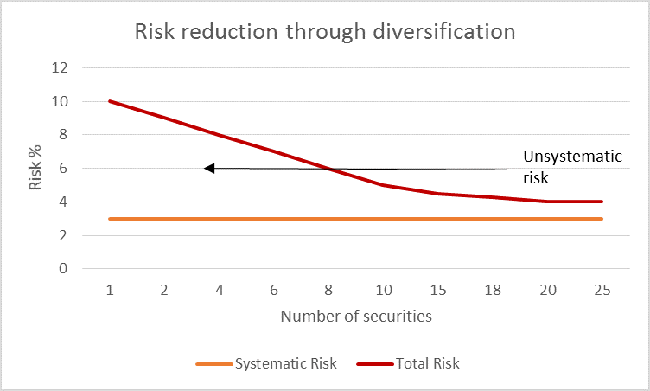
Two things are noteworthy in this graph:
- Unsystematic risk reduces with an increase in the number of securities in the portfolio.
- Systematic risk does not reduce with an increase in the number of securities. It remains constant.
How does one measure the systematic and unsystematic risk of a mutual fund scheme? You do that by calculating the standard deviation and the beta of the fund.
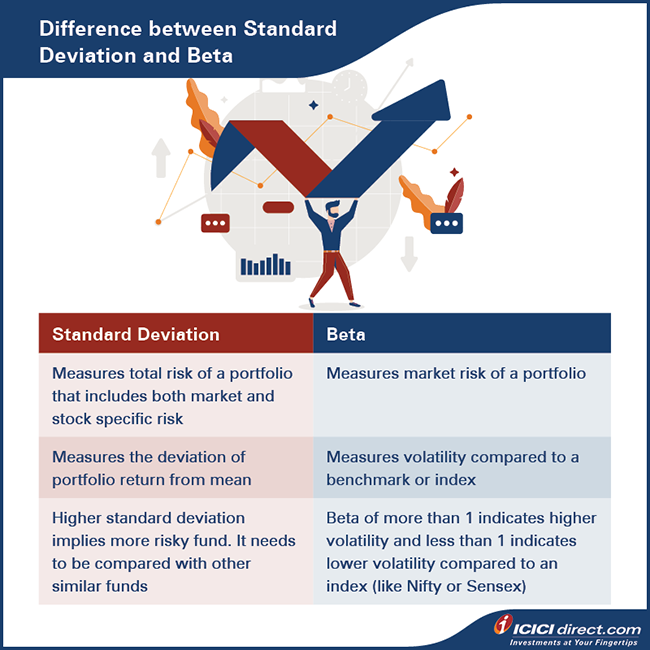
Standard deviation
Standard deviation is used to measure the total risk of a portfolio. Total risk is the sum of systematic risk and unsystematic risk. Here’s a simple formula:
Total Risk = Systematic Risk + Unsystematic Risk
(This is expressed as a percentage figure that is annualized.) Aside from being an indicator of a portfolio’s overall risk, standard deviation also reveals the consistency of the returns. It can be measured by calculating the deviation from the mean.
What could the standard deviation say about an equity mutual fund?
High standard deviation:
This suggests that the fund experiences high volatility and is therefore subject to high risk.
Low standard deviation:
This generally implies consistency in the fund’s performance and suggests that the fund is a low-risk one.>
Here’s an example to show how standard deviation is calculated:
Smita, a marketing professional, is torn between two equity mutual fund schemes—Fund A and Fund B. She consults her financial adviser. The financial adviser quickly compares the performance of the two funds over the past five years.
|
Fund A |
Fund B |
||||
|
Annual Returns |
Deviation from the Mean Return |
A^2 |
Annual Returns |
Deviation from the Mean Return |
B^2 |
|
10% |
–2% |
0.040% |
15% |
3% |
0.090% |
|
12% |
0% |
0.000% |
25% |
13% |
1.690% |
|
15% |
3% |
0.090% |
–10% |
–22% |
4.840% |
|
8% |
–4% |
0.160% |
20% |
8% |
0.640% |
|
15% |
3% |
0.090% |
10% |
–2% |
0.040% |
|
Variance = Average of A^2 |
0.076% |
Variance = Average of B^2 |
1.460% |
||
|
Standard Deviation = (Variance)^(1/2) |
2.757% |
Standard Deviation = (Variance)^(1/2) |
12.083% |
||
Smita can now calculate the average returns of both funds over the past five years.
- Average return of Fund A = (10% +12%+15%+8%+15%)/5 = 12%
- Average return of Fund B = (15% +25%-10%+20%+10%)/5 = 12%
Smita notes that the average returns of Fund A and Fund B are equal at 12%. She wonders if this means both funds are equally good. Her financial adviser responds by pointing out two things:
- Fund A has more consistent returns and shows less volatility.
- The standard deviation of Fund A is lower than that of Fund B.
That means Fund A carries less risk than Fund B. In this particular scenario, Fund A is the better choice.
Did you know?
Standard deviation can also be calculated by using a formula on an Excel spreadsheet.
For example: STDEV.P (10%,12%,15%,8%,15%) = 2.757%.
Beta
Beta measures the volatility of a stock or fund with respect to stock indices like Nifty whose beta is considered as one.
Let’s consider two possibilities:
- A fund’s beta is more than one: Such a fund is considered more volatile than its index. It is preferred by aggressive investors who have high risk appetites.
- A fund’s beta is less than one: Such a fund experiences low volatility. It is suitable for conservative investors who have a low tolerance for risk.
Beta also represents the market risk or systematic risk. The beta of a fund is the weighted average of individual stocks in a fund.
Here’s an example to help you calculate the beta of a fund:
Suppose a fund has three stocks—A, B, and C.
- A comprises 50% of the fund portfolio.
- B comprises 30% of the fund portfolio.
- C comprises 20% of the fund portfolio.
So, the weightage of A is 50%, B is 30%, and C is 20%.
To this we add another piece of information—the beta of stocks A, B, and C.
- A has a beta of 1.2.
- B has a beta of 0.8.
- C has a beta of 1.5.
Now, the beta of the fund can be calculated:
Fund beta = (50% *1.2) + (30%*0.8) + (20%*1.5) = 0.6 + 0.24 + 0.3 = 1.14
The fund beta is higher than one. This implies that:
a)the fund portfolio is likely to experience a slightly higher volatility, and
b)the fund is better suited to investors who have a higher tolerance for risk.
Using these two measures, you can calculate the risk involved in investing in the fund and whether it is a good fit for you.
Summary
- When choosing an equity mutual fund to invest in, look for:
- The risk involved
- The potential for returns
- The risk-reward ratio
- There are two kinds of risks involved in equity investments: systematic risk and unsystematic risk.
- Systematic risk refers to the overall market risk. It is neither sector-specific nor related to any specific company. They are non-diversifiable.
- Sector-specific or company-specific risks are unsystematic risks. They are also called diversifiable risks.
- Standard deviation is a metric used to measure the total risk of a fund. It is calculated as:
- Total Risk = Systematic Risk + Unsystematic Risk
- Higher standard deviation means higher risk and vice-versa.
- Beta is the measure used to calculate the volatility of a stock or fund with respect to stock indices. It measures market or systematic risk.
- The beta of stock indices is considered to be one. A fund with a beta of less than one indicates lower sensitivity to market volatility and a beta greater than one denotes higher sensitivity to market volatility.
Standard deviation and beta are two common risk-evaluation metrics for equity mutual funds. In the next chapter, we will look at other risk-return ratios like the Sharpe ratio, Treynor ratio and Sortino ratio, among others.


Please Enter Email


COMMENT (0)