loader2
Partner With Us NRI

Hester Biosciences Ltd share Price Today

Company details

1,760.00
1,786.40
1,292.85
1,939.95
6M Return 14.36%
1Y Return -2.44%
Mkt Cap.(Cr) 1,512.54
Volume 2,786
Div Yield 0.34%
OI
-
OI Chg %
-
Volume 2,786

Open Free Trading Account Online with ICICIDIRECT

Incur '0' Brokerage upto ₹500
Animal health drives sales as poultry decline continues
About The Stock

    Hester is one of India’s leading animal healthcare companies & the second largest poultry vaccine manufacturer in the country. It has a strategic presence in 30+ countries with key markets being India, Nepal and Tanzania.

    • It operates through four broad verticals: poultry vaccines, poultry health products, animal vaccines and animal health products
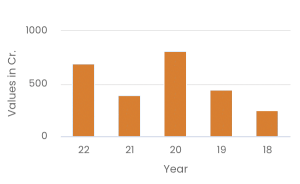
    • Sales break-up for Q3FY23: Poultry healthcare: 42%, Animal healthcare: 58%
Q3FY23

    Animal healthcare boosted revenues, gross margins impacted due to stock write off.

    • Sales were up 34.6% YoY to ₹ 75 crore
    • EBITDA was at ₹ 19 crore, up 24.9%, with margins at 25%
    • Adjusted PAT was at ₹ 12.3 crore (up 45% YoY)

Click here for full recommendation

Research view on more stocks

Pharmaceuticals company Hester Biosciences announced Q4FY24 & FY24 results:

Financial Highlights:

  • Hester Biosciences reported an increase in standalone revenue by 20% and consolidated revenue by 18% in Q4FY24 compared to the previous year.
  • The audited financial results for Q4 & FY24 show the company's resilience with a recommendation for a dividend of 6 per equity share of Rs 10 each (60%) for FY24, awaiting shareholder approval.
  • The company has reduced its borrowing by 19% and increased cash generated from operations by 28% during the year.
  • Overall gross profit margin in Q4FY24 increased by 1% compared to Q4FY23, primarily due to the increase in the proportion of vaccines from 60% to 75% in Q4FY24.
  • In Q4FY24, EBITDA increased by 14% in alignment with a growth in sales, resulting in a 19% increase in PAT for the quarter.
  • The total borrowings of the Company has reduced by Rs 307.58 million (19%) during the year.
  • The cash generated from operations has increased by Rs 94.50 million (28%) during the year

Animal Healthcare Division:

  • The Animal Healthcare division saw a growth of 89% in Q4FY24, driven by sales of Goat Pox vaccine and vaccines for a government immunisation program.
  • Despite regulatory challenges, the Animal Healthcare division has demonstrated the ability to recover and sustain growth.

Poultry Healthcare Division:

  • The Poultry Healthcare division achieved a notable growth of 22% in Q4FY24, with a consistent upward trend throughout the year.
  • Strategic introductions of new products and leveraging market opportunities have been instrumental in the division's sales performance.

Petcare Division:

  • In Q4FY24, the Petcare division saw a minor decrease in sales from the previous quarter but reported a notable annual growth of 49%.
  • The Petcare division's focus on building a strong foundation and delivering high-quality products is reflected in its substantial growth.

Result PDF

View Other Company Results

Hester Biosciences Ltd shares SWOT Analysis

Strengths (6)

  • Strong Momentum: Price above short, medium and long term moving averages
  • Rising Net Cash Flow and Cash from Operating activity
  • Growth in Net Profit with increasing Profit Margin (QoQ)

Weakness (4)

  • Inefficient use of capital to generate profits - RoCE declining in the last 2 years
  • Inefficient use of shareholder funds - ROE declining in the last 2 years
  • Inefficient use of assets to generate profits - ROA declining in the last 2 years

Opportunity (2)

  • Negative to Positive growth in Sales and Profit with Strong Price momentum
  • RSI indicating price strength

Threats (2)

  • High PE (PE > 40)
  • Increasing Trend in Non-Core Income

Resistance and support

R1 1,799.6
R2 1,819.4
R3 1,843.9
Pivot

1,775.18

S1 1,755.4
S2 1,730.9
S3 1,711.1
EMA SMA
1,679.8
1,596.5
1,560.0
1,589.6
1,682.4
1,546.1
1,510.1
1,578.2
Delivery and volume
CLIENT NAME DEAL TYPE ACTION DATE AVG. PRICE QUANTITY EXCHANGE
RAJIV DINESH GANDHI Bulk Purchase 2017-03-22 732.1 90000 BSE
HESTER COATINGS PRIVATE LIMITED Bulk Sell 2017-03-22 732.1 90000 BSE
RAJIV DINESH GANDHI Block Purchase 2017-03-22 732.1 90000 BSE
Name Category Shares
Rajiv Dinesh Gandhi PROMOTER 10.47%
Sanjiv Dinesh Gandhi PROMOTER 8.2%
Nina Rajiv Gandhi PROMOTER 8.19%
Shaila Bhupendra Gandhi PROMOTER 5.78%
Bhupendra Vithaldas Gandhi PROMOTER 4.69%
Anup Chandravadan Kapadia PROMOTER 2.68%
Biolink Healthcare Limited PROMOTER 2.93%
Hester Coatings LLP PROMOTER 0.75%
Ravin Gandhi PROMOTER 4.74%
Bela Gandhi PROMOTER 4.71%

OUR RESEARCH VIEW

Investment recommendation
Animal health drives sales as poultry decline continues
Call Date
02 Feb 2023
Entry Price 1,790.00
Target Price 1,830.00
Duration
12-18 Month

FINANCIALS

Sales
Operating Profit
Profit after Tax
Equity
Reserves and Surplus
Debt
Sales
Operating Profit
Profit after Tax
PE
Debt/Equity
P BV

Hester Biosciences Ltd Stocks COMPARISON

Financials( in Cr) Hester Biosciences Ltd Sun Pharmaceuticals Industries Ltd Cipla Ltd Zydus Lifesciences Ltd Divis Laboratories Ltd
Price 1,778.00 1,531.05 1,399.05 1,052.80 3,907.00
% Change 1.27 0.24 -0.54 5.59 0.37
Mcap Cr 1,512.54 367,350.19 112,954.68 105,936.32 103,718.74
Revenue TTM Cr 266.09 43,885.68 15,790.60 17,237.40 7,767.51
Net Profit TTM Cr 28.04 8,560.84 2,513.47 1,997.30 1,823.38
PE TTM 80.53 39.29 26.93 30.43 75.45
1 Year Return -2.44 60.66 51.61 103.34 19.24
ROCE 9.01 16.79 14.76 16.25 19.30
ROE 10.39 16.46 10.66 14.05 14.89
INSIDER & INSTITUTIONAL ACTIVITY

Equity Capital: 279.73 Cr FV: 10.00

Period MF Net Purchase / (sold) FII Net
LAST 1M 39,908.21 -32,861.14
LAST 3M 100,212.68 -40,336.57
LAST 6M 168,007.15 51,016.84
LAST 12M 259,938.69 133,487.81
Hester Biosciences Limited - Analysts/Institutional Investor Meet/Con. Call Updates

May 14, 2024 l NSE Announcement

Hester Biosciences Limited - Analysts/Institutional Investor Meet/Con. Call Updates

May 13, 2024 l NSE Announcement

NSE Board Meetings Forthcomming

May 10, 2024 l NSE Board Meetings Forthcomming

Date Action Type Ratio
Sep 13, 2023 Dividend 80
Aug 11, 2022 Dividend 100

Hester Biosciences Ltd Information

Stock PE (TTM)
80.53
Promoter Holding
53.73%
Book Value
343.0134
ROCE
9.01%
ROE
10.39%
Description
  • Incorporated as a private limited company in Apr.`87, Hester Pharmaceutical (HPL) was converted into a public limited company in Nov.`93. HPL markets and distributes veterinary and pharmaceutical products like animal health products, poultry vaccines, poultry diagnostic, laboratory kits and reagents. It markets the veterinary products of many international companies including Ghen Corporation, Japan; Maine Biological Laboratories, US; Idexx Corporation, US; International Diagnostic Systems Corporation, US; Biogal Galed Laboratories, Israel; and Kemin Europa, Belgium. The company`s own production of veterinary vaccines (in Vials) is expected to commence soon. HPL has technical collaborations with Maine Biological Laboratories and Ghen Corporation. During 1996-97, company successfully implemented veterinary vaccine and commercial production has begun. The company has received licenses for producing 10 additional poultry vaccines.It has also signed an manufacturing agreement with Sinsui Inc for producing poultry vaccines.

Registered Address

1st Flr PushpakPachvati Circle, Motilal Hirabhai Road, Ahmedabad, Gujarat, 380006

Tel : 91-079-26445107
Email : investor:hesterbiosciences.co.in
Website : http://www.hester.in
Registrar

Sharepro Services India Pvt Lt

AGM Date (Month) : Sep
Face Value Equity Shares : 10
Market Lot Equity Shares : 1
BSE Code : 524669
NSE Code : HESTERBIO
Book Closure Date (Month) : Sep
BSE Group : B
ISIN : INE782E01017

FAQ’s on Hester Biosciences Ltd Shares

You can buy (#CompanyNm) shares through a brokerage firm. ICICIdirect is a registered broker through which you can place orders to buy (#CompanyNm) Share.

Company share prices and volatile and keep changing according to the market conditions. As of (#UpdateDate) the closing price of (#CompanyNm) was Rs.(#LTP).

Market capitalization or market cap is determined by multiplying the current market price of a company�s shares with the total number of shares outstanding. As of (#UpdateDate), the market cap of (#CompanyNm) stood at Rs. (#MarketCap).

The latest PE ratio of (#CompanyNm) as of (#UpdateDate) is (#PE)

The latest PB ratio of (#CompanyNm) as of (#UpdateDate) is (#PB)

The 52-week high of (#CompanyNm) share price is Rs. (#52WeekHigh) while the 52-week low is Rs. (#52WeekLow)

According to analyst recommendations, (#CompanyNm) Share has a "(#BuyOrSell)" rating for the long term.

Download Our

Download App
market app