


Download
iLearn application
Elevate Your Financial Knowledge with the
ICICI Direct iLearn App


The stock market operates in highs and lows. Traders and investors are presented with opportunities and challenges as the market goes through various trends as well as fluctuations. While a bullish market signifies rising prices and optimism, a bearish market indicates a downward trend, with declining prices and pessimism. It is often assumed that maximum profits can be made only when the market is bullish. However, a bearish market also has the potential to provide profits if one makes informed decisions according to the trends.
A bearish market, also known as a bear market, refers to a period characterised by falling stock prices and overall pessimistic sentiments in the market. It is the opposite of a bullish market, where prices rise, and investor confidence is high. In a bearish market, traders tend to be cautious and may sell off their holdings, leading to further declines in prices. A bearish market is typically driven by bearish indicators or factors such as economic downturns, geopolitical tensions, or negative sentiment among market participants. One of the key indicators of a bearish trend is a sustained downtrend in major market indices. When Nifty and Sensex consistently show a downward trajectory, it suggests a bearish market sentiment. If these indices show patterns such as lower lows and lower highs, it indicates a bearish market trend. High trading volumes during a downtrend suggest increased selling pressure, reinforcing the bearish outlook.
Let us understand some technical trends to watch out for during a bearish market:
It calculates the average price of a security over a specified time period by adding together the closing prices for each period and dividing the sum by the number of periods. The SMA smooths out price fluctuations, providing traders with a clearer picture of the underlying trend. It is particularly useful for identifying support and resistance levels, determining entry and exit points, and confirming trend reversals.
In order to calculate SMA, you must select a time frame. For example, you can choose 20-day, 50-day, or 200-day moving averages. This indicates the average price of the security over the selected time period. When the price of the security is above the security line, it suggests an uptrend, while prices below the SMA indicate a downtrend.
Simple moving averages can act as support or resistance levels for a stock’s price movement. If the price consistently fails to surpass the SMA during an uptrend, it may indicate a strong support level. Conversely, if the price consistently fails to surpass the SMA during a downtrend, it may indicate a strong resistance level.
The crossover of two different simple moving averages is often considered a significant trading signal. A bearish crossover occurs when a shorter-term SMA (e.g.- 20-day) moves below a longer-term SMA (e.g.- 50-day). This indicates a potential downward trend. When such a trend is seen on a chart, it is known as a ‘Death Cross.’
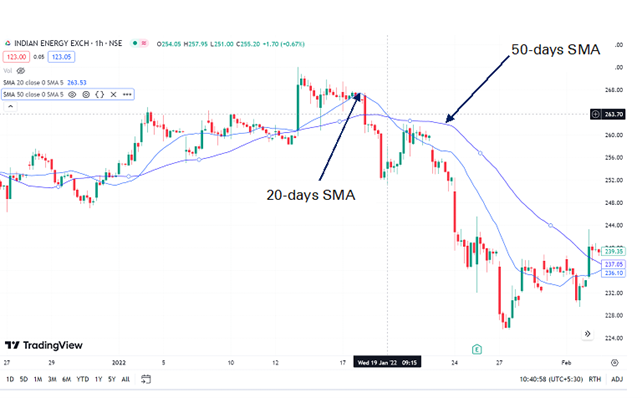
In the above chart, we can determine the potential downtrend as the 20-day moving average falls below the 50-day moving average.
Since SMAs rely on past data to generate signals, they may not provide timely indications of rapid price changes or market volatility. Therefore, it might be wise to use them in conjunction with other indicators.
Exponential moving average assigns greater weightage to recent price data, making it more responsive to current market conditions. Unlike the simple moving average, which assigns equal weightage to all data points, EMAs give more prominence to the most recent prices.
EMAs are calculated by taking the closing prices of a security over a specified period and applying a smoothing factor to the calculation. The smoothing factor determines the weight given to the recent price data, with higher values resulting in greater responsiveness to recent price changes.
During a bearish market, EMAs can help to determine the prevailing downtrend by analysing the relationship between short-term and long-term EMAs. Typically, a common approach is to compare the 50-day EMA (short-term) with the 200-day EMA (long-term). When the short-term EMA falls below the long-term EMA, it signals a potential bearish trend.
Analysing EMA crossovers can also help in determining trends. When a short-term EMA, such as the 9-day or 20-day EMA, crosses below a longer-term EMA, such as the 50-day or 100-day EMA, it suggests increased selling pressure and reinforces the bearish sentiment. These crossover signals can be used as potential selling opportunities or indicators to stay out of the market.
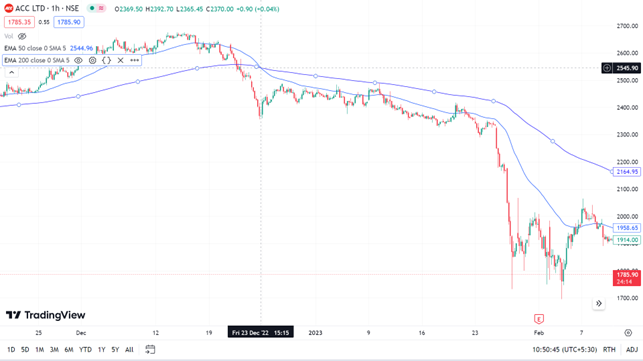
In the above chart, when the 50-day EMA falls below the 200-day EMA, a bearish crossover is seen. There is a downtrend in the share price after the crossover.
EMAs can also act as dynamic resistance levels during a bearish market. When prices approach the EMA line from above and get rejected, it indicates a potential selling zone. Traders use this to plan entry or exit points and set stop-loss orders accordingly.
EMAs can be used as reference lines to identify potential short-selling opportunities. If the price consistently remains below a particular EMA, it indicates a strong bearish trend, providing opportunities for short-selling or taking advantage of downside movements.
This indicator is used to assess the direction and momentum of a security. It consists of two lines: the MACD line and the signal line, along with a histogram.
The MACD line is calculated by subtracting the 26-day exponential moving average from the 12-day exponential moving average. It represents the difference between the short-term and the longer-term moving averages. During a bearish market, the MACD line tends to decline, reflecting the downward momentum.
The signal line is a 9-day EMA of the MACD line. It acts as a trigger for buy or sell signals. In a bearish market, the signal line generally stays below the MACD line, confirming the downward trend.
The histogram is derived by plotting the difference between the MACD line and the signal line. It provides visual representation of the convergence and divergence between the two lines. When the histogram bars are negative and increasing in size, it indicates strong bearish momentum.
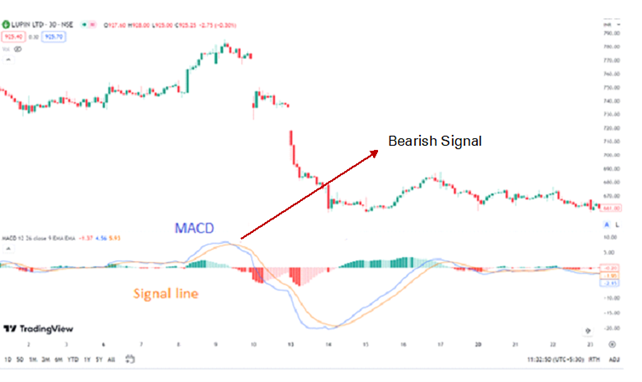
When the MACD line crosses below the signal line, it generates a bearish signal. This crossover suggests that the selling pressure is intensifying and that the downward trend is gaining strength. Traders may consider selling or short-selling positions in such scenarios. In addition, when the histogram bars are consistently negative and widening, it signifies increasing selling pressure and a strengthening bearish market. This could be an opportunity to capitalise on the downward movement by taking short positions or implementing bearish strategies.
Usually, bearish sentiments are considered a slow growth period. However, various strategies can be implemented during a bearish period to preserve gains. Recognising bearish reversal patterns with the help of these technical indicators could be useful to navigate through a bearish market. Since these technical indicators respond to rapid fluctuations, it is advisable to use them in conjunction with other indicators such as Relative Strength Index (RSI).
One such technical indicator is the Moving Averages indicator. It is normally used to identify trend reversals, which could lead to the identification of a bearish period. And just like the moving average indicator there are various other indicators that show trend reversals, there are technical indicators for bullish periods too.
Take Moving Averages for example. In a Simple Moving Average, if the price of an asset is below the security line, it indicates a downtrend, while in Exponential Moving Average when the short-term EMA falls below the long-term EMA it signals a potential bearish trend. Different indicators have different methods to analyze potential bearish trends.
Traders use different strategies to buy stocks, such as buying at support levels and selling at resistance levels, or simply following the trend. However, timing the market is challenging. To make informed decisions, use technical indicators and candlestick patterns to support your research.
Learn how to calculate the break-even point in commodity trading by factoring in brokerage, taxes, and other charges
Learn how ICICI Direct's Auto Order Slicing automatically splits large commodity orders for faster, seamless execution while complying with exchange limits.
Learn about a BSDA account, its eligibility criteria, annual maintenance charges, and the latest SEBI rules for Basic Services Demat Accounts.


Elevate Your Financial Knowledge with the
ICICI Direct iLearn App
Elevate Your Financial Knowledge with the
ICICI Direct iLearn App
