


Download
iLearn application
Elevate Your Financial Knowledge with the
ICICI Direct iLearn App


When there are bullish sentiments, the market frenzy might make it confusing to determine what step to take. Should you exit your position when the price is still high? What if it goes further up? What is the exact time to enter a trade before its price shoots up? How does one navigate through such a market? This article covers 3 technical indicators which can be used during a bullish market to understand the momentum.
Before diving into the specific technical trends, it’s important to understand what a bullish market means. A bullish market refers to a market environment where prices are generally increasing over an extended period. It is characterized by trader optimism, positive economic indicators, and a general belief that asset prices will continue to rise.
Identifying bullish trends or bullish indicators can help one capitalize on potential profit opportunities. While there are various methods to assess market sentiment, technical analysis provides valuable tools and bullish indicators to spot bullish trends and confirm the prevailing market sentiment.
Moving averages are indicators that calculate the average price of a security over a specific period. They help to smooth out price fluctuations which helps in identifying and evaluating the underlying trends. The two most common types of moving averages are the simple moving average (SMA) and the exponential moving average (EMA).
The simple moving average takes the sum of a security’s closing prices over a predetermined period and divides it by the number of periods. For example, a 50-day SMA would consider the average closing prices of the past 50 trading days. SMA offers a straightforward interpretation of price trends.
On the other hand, the exponential moving average places more emphasis on recent prices, giving greater weightage to the latest data. This makes EMA more responsive to recent market changes, allowing traders to capture immediate shifts in trends.
Moving averages act as support and resistance levels in a bullish market. During an uptrend, the price often bounces off the moving average, indicating a support level. This information can be used to identify entry and exit points. Moving averages can help traders gauge the strength of a bullish trend. A consistent upward slope of the moving average confirms the strength and substantiality of the market trend.

The crossover of two different moving averages is often considered a significant trading signal. The ‘Golden Cross’ occurs when a short-term moving average, like the 50-day SMA, crosses above a longer-term moving average, such as the 200-day SMA. In the chart above, we can see this trend after the golden cross. This is seen as a bullish signal, indicating a potential upward momentum.
Moving averages can also help traders with entry and exit strategies. During a bullish market, a trader might choose to enter a position when the price of a stock crosses above its moving average. Similarly, an exit strategy can be implemented when the price falls below the moving average, potentially indicating a downward trend.
Bollinger bands are a widely used tool in technical analysis. They consist of three lines: the middle band, which is a simple moving average (SMA) of the security’s price over a certain period; and two outer bands, placed above and below the middle band, representing the standard deviation of the price from the SMA. The standard deviation acts as a measure of volatility. In simple words, it indicates how much the price has deviated from the average. The bands adjust dynamically based on market volatility, widening during periods of high volatility and narrowing during periods of low volatility.
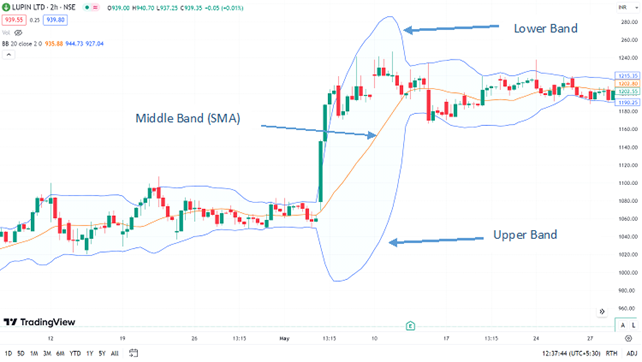
When the market is bullish, Bollinger bands can be used for identifying potential overbought and oversold conditions. When prices consistently touch or surpass the upper band, it suggests that the security may be overbought, and a short-term correction or pullback could be imminent. Conversely, when prices consistently touch or fall below the lower band, it indicates that the security may be oversold, presenting a potential buy opportunity.
Bollinger bands’ dynamic nature allows them to adapt to changing market conditions. During periods of low volatility, the bands contract, while during high volatility, they expand. Spotting volatility shifts can help traders gauge the market’s sentiment and anticipate potential breakouts or reversals. In a bullish market, expanding Bollinger bands may indicate that the uptrend is gaining strength.
For trend-following traders in a bullish market, Bollinger bands can serve as a guide for riding the trend. When a price consistently moves along the upper band, it signals a strong and sustained uptrend, providing confidence to stay invested in the asset. They can also be used to set stop-loss levels, especially during periods of high volatility. Placing stop-loss orders just beyond the outer bands can help traders protect their positions while still allowing for potential price fluctuations.
However, Bollinger Bands are most effective when used with other technical indicators, such as the Relative Strength Index (RSI) or Moving Average Convergence Divergence (MACD), to confirm signals or identify potential divergences, further validating entry and exit points.
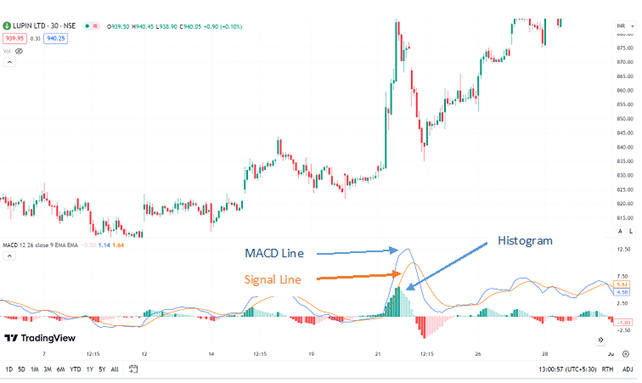
MACD is a versatile indicator that combines two exponential moving averages (EMAs) to identify changes in the market momentum. The MACD line is calculated by subtracting the 26-period EMA from the 12-period EMA. In addition, a 9-period EMA, known as the signal line, is plotted on the MACD line to provide buy or sell signals.
With the use of MACD, traders can spot trend reversals. During a bullish market, when the MACD line crosses above the signal line, it is a bullish signal, indicating that the uptrend is gaining momentum. This can be an entry point for long positions. On the other hand, when the MACD line crosses below the signal line, it is a bearish signal. This suggests a potential trend reversal and a signal to exit long positions or to consider short positions.
The MACD histogram is derived from the difference between the MACD line and the signal line. It represents the momentum of price movements. When the histogram bars are above the zero line and expanding, it indicates strong upward momentum. Traders use this information to gauge the strength of the bullish trend as seen in the chart below.
MACD when paired with a moving average crossover strategy can validate potential entry and exit points. When the MACD generates a bullish signal along with a golden cross, it reinforces the bullish sentiment.
The Relative Strength Index (RSI) is a momentum indicator often used in technical analysis. It measures whether a particular security is overvalued or undervalued by gauging any significant price changes. The RSI is represented by a single line oscillating between 0-100. If the line goes above 70, the asset is considered to be overvalued, and if it goes under 30, it is considered to be undervalued.
The RSI does more than just point out overbought or oversold conditions; it also helps indicate any trend reversal or corrective pullback in the price. On the other hand, it can also signal when to buy and sell. As helpful as one indicator could be, it is always better to back up any hypothesis with the help of other indicators and even candlestick patterns.
As the name suggests, this pattern consists of 2 parts: the cup and the handle. The cup usually forms out of a bearish advance, followed by a period of consolidation until it rises again. The handle, however, looks like a pennant or flag pattern. In terms of size, the handle should be below 50% of the cup; preferably, it should only be 1/3rd of the cup. The cup is associated with higher trading volumes, while the handle is associated with lower trading volumes.
After the handle is formed, one should expect a breakout and the market to rise. A breakout is also associated with high trading volumes. When visually analyzing this pattern, make sure that the cup is U-shaped, as it indicates a stronger signal.
One can use many indicators and candlestick patterns to identify a bullish signal. For example, in Moving Average Convergence Divergence uses two EMAs to identify changes in market momentum, and if the MACD line goes above the signal line, it is considered to be a bullish signal.
MACD is a versatile indicator combining two exponential moving averages (EMAs) to identify changes in the momentum during a bullish market. It can also help one identify a bearish market. Here are a few more bearish indicators you can check out.
There’s no straightforward answer to this question as traders may employ varying trading strategies. However, as a trader, you can use various strategies and indicators to identify if it is a good time to buy a stock in a bullish market. For example, you can use a momentum indicator like RSI to gauge if an asset is overvalued or undervalued, depending on the price change. You can also use indicators like moving averages to determine support and resistance points and identify entry and exit points.
Traders can use indicators to make informed decisions about price movements and trend direction during a bullish market. These indicators help investors identify the strength of a bullish trend, allowing traders to take positions accordingly. Technical indicators are best used in conjunction with other indicators for confirmation. For instance, Bollinger bands are often used together with the Relative Strength Index (RSI).
Learn how to calculate the break-even point in commodity trading by factoring in brokerage, taxes, and other charges
Learn how ICICI Direct's Auto Order Slicing automatically splits large commodity orders for faster, seamless execution while complying with exchange limits.
Learn about a BSDA account, its eligibility criteria, annual maintenance charges, and the latest SEBI rules for Basic Services Demat Accounts.


Elevate Your Financial Knowledge with the
ICICI Direct iLearn App
Elevate Your Financial Knowledge with the
ICICI Direct iLearn App
