


Download
iLearn application
Elevate Your Financial Knowledge with the
ICICI Direct iLearn App


A candlestick displays the open, close, high and low price of the underlying asset for a time period. In a typical candlestick chart, each candlestick represents a specific time period, such as a day, a week, or an hour. The colour of the candlestick can indicate whether the price of the asset rose or fell during that time period. A green or white candlestick indicates that the price rose, while a red or black candlestick indicates that the price fell.
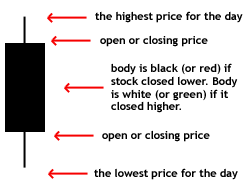
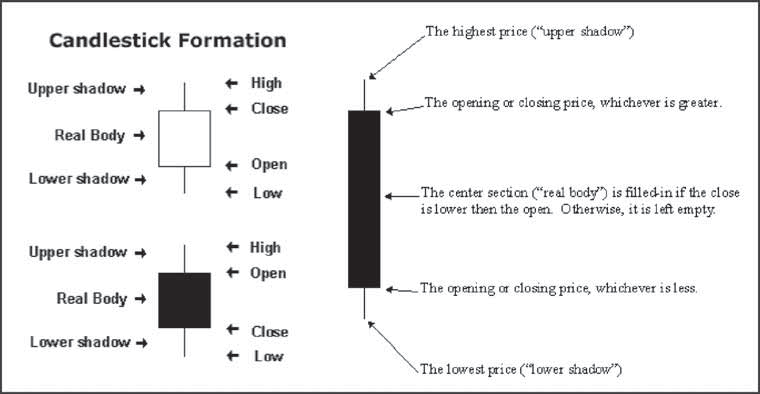
Simply, a candlestick has 5 factors; High, low, close, open and the body.
Let us look at a couple of the candlestick patterns and their significance:
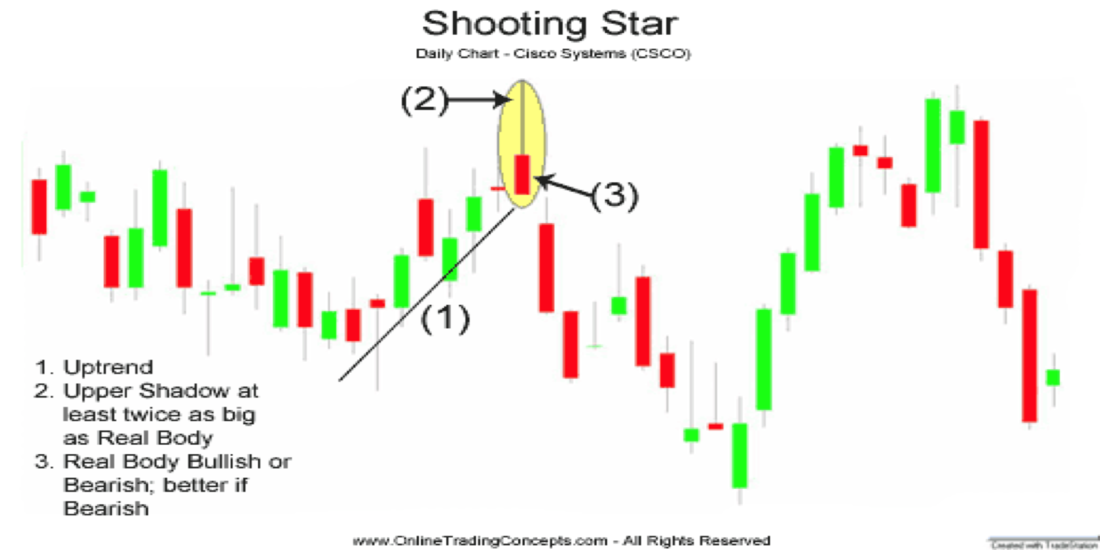
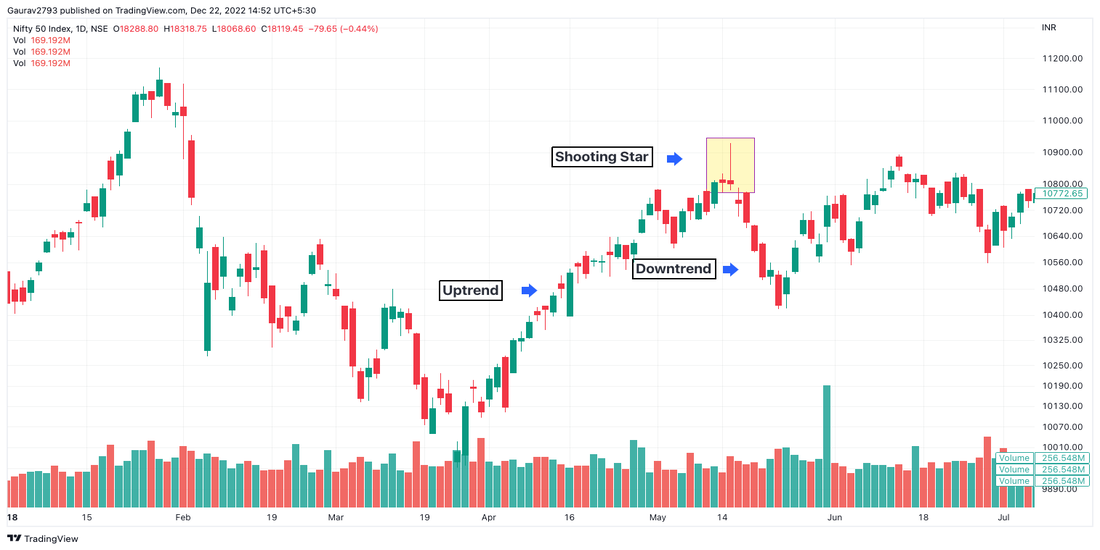
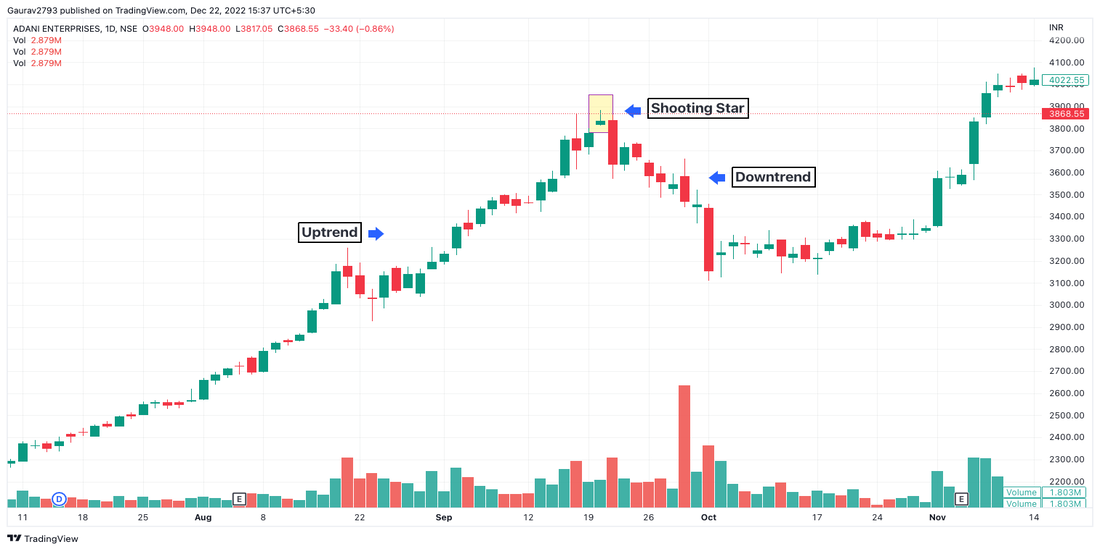
The "shooting star" pattern appears at the peak of an uptrend; its long upper wick indicates that resistance to further bullish movement has been observed above the close, and a bearish reversal is possible.
The Shooting Star, as its name implies, is a bearish reversal pattern that develops following an advance and in the star position.
Market view
When prices open with a gap up, rise throughout the trading day, and close far from their highs, a shooting star is formed. The resulting candlestick has a small, green or red body and a long upper wick. To indicate a substantial reversal, the upper wick is relatively long and at least 2 times the length of the body. The long upper shadow suggests that buyers were able to push prices higher during the trading session, but selling pressure eventually overwhelmed them, causing prices to close near the session low. This indicates that the bullish momentum may be fading, and bears may be gaining control.
Criteria
Trade setup
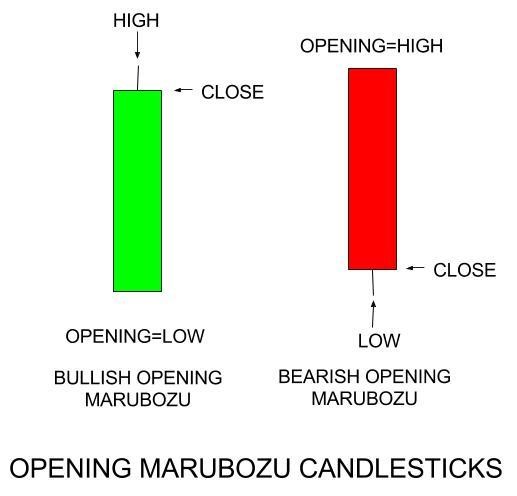
A "marubozu" represents a strong continuation of the current trend. Marubozu does not have upper or lower wicks, and the high and low are represented by the open or close.
Market view
A green Marubozu forms when open=low and close=high. This indicates that buyers controlled the price action from the first trade to the last trade. Red Marubozu forms when the open=high and close=low. This indicates that sellers controlled the price action from the first trade to the last trade.
Criteria
Trade setup
To read about candlesticks and technical analysis in detail, click here
The hammer candle is a bullish pattern indicating the end of a downtrend, while the shooting star is a bearish signal that shows the end of an uptrend.
While the shooting star is a single candle pattern that the price could start dropping, the evening star consists of three candlesticks and is used to predict price reversals to the downside.
No, it is a bearish reversal candlestick that has a long upper shadow, little or no lower shadow and a small real body near the low of the day.
A shooting star is another version of a gravestone doji. Both of these are reversal patterns that are seen after an extended uptrend, with one minor difference being the size of their bodies, and that the shooting star has a long upper wick and a negligible lower wick.
Gold can react to inflation data, while crude oil may jump after an inventory report or geopolitical disruption.
Understand how crude oil trading works on MCX and also learn about contract sizes, expiry, trading hours, global benchmarks, price drivers and risks before you trade.
Learn how to calculate the break-even point in commodity trading by factoring in brokerage, taxes, and other charges


Elevate Your Financial Knowledge with the
ICICI Direct iLearn App
Elevate Your Financial Knowledge with the
ICICI Direct iLearn App
