


Download
iLearn application
Elevate Your Financial Knowledge with the
ICICI Direct iLearn App


Investing in stocks can be a rewarding but challenging endeavor. One of the key factors in making sound investment decisions is understanding the intrinsic value of a stock. Intrinsic value represents a stock's true worth based on its fundamentals, and calculating it requires a deep analysis of various factors. In this article, we will explore different methods for calculating the intrinsic value of a stock, accompanied by examples to illustrate the concepts.
Intrinsic value is the estimated value of a stock based on its underlying financials, potential future cash flows, and risk. It is different from the market price, which can be influenced by various market dynamics and investor sentiment. Investors often seek to buy stocks that are trading below their intrinsic value, believing that the market will eventually correct itself. It's not always possible to find a stock that's trading below its intrinsic value. Sometimes, due to positive future prospects or favourable market conditions, stocks can be traded above their intrinsic value. However, it's still important to know the fair value of stocks.
Calculating intrinsic value requires a lot of estimation, like growth rate in EPS, dividend policies, future P/E ratio, sustainability of cash flows, etc. and that's why many investors prefer to have this job done by some qualified analyst. But as an investor, knowing what goes beyond this calculation is important. Let's understand a few popular methods to calculate the intrinsic value.
· Discounted Cash Flow (DCF) Method
· Dividend Discount Model (DDM)
· Comparable Company Analysis
DCF analysis is a widely used method for estimating intrinsic value. It involves projecting a company's future cash flows and discounting them back to their present value. Before going further, let's understand what cash flow is and how it is calculated.
Cash is flowing in the firm when a firm sells its product, i.e., revenue is generated. After paying its operating expenses like salary and taxes, the company uses the cash for short-term requirements like working capital and long-term investments in Property, Plant and Equipment (PP&E). The amount left after these provisions is known as Free Cash Flow to Firm (FCFF) and the firm can use this amount to pay its investors, i.e., bondholders and shareholders.
Some analysts also use Free Cash Flow to Equity (FCFE) instead of FCFF. FCFE is calculated by subtracting the interest amount paid to bondholders from FCFF. This model is suitable for companies that don't pay dividends or pay minimal dividends compared to their cash flows.
The formula for DCF analysis is as follows:
Intrinsic Value = Sum of [(Cash Flow / (1 + Discount Rate) ^n)]
Where:
- Cash Flow represents the expected future cash flow in each period (usually projected for several years)
- Discount Rate is the rate of return expected by an investor (usually the company's cost of capital)
- 'n' is the number of periods in the future
Example: DCF Analysis
Let's consider a hypothetical company, ABC Corporation, which is expected to generate the following annual cash flows for the next five years: 20 lac, 25 lac, 30 lac, 35 lac and 40 lacs. The discount rate used is 10%.
Year 1: 20 lac / (1 + 0.10)^1 = 18.2 lac
Year 2: 25 lac / (1 + 0.10)^2 = 20.7 lac
Year 3: 30 lac / (1 + 0.10)^3 = 22.5 lac
Year 4: 35 lac / (1 + 0.10)^4 = 23.9 lac
Year 5: 40 lac / (1 + 0.10)^5 = 24.8 lac
Now, sum up these present values: 18.2 lac + 20.7 lac + 22.5 lac + 23.9 lac + 24.8 lac = 110.1 lac
The intrinsic value of ABC Corporation, based on DCF analysis, is approximately 110.1 lac. If a company has 1 lac share, then the intrinsic value of a share is 110.1 lac / 1 lac = Rs. 110.1
The Dividend Discount Model (DDM) calculates intrinsic value based on the present value of expected future dividend payments. This method is suitable for companies that pay dividends to shareholders.
The formula is as follows:
Intrinsic Value = Sum of [(Dividend / (1 + Discount Rate)^n)] + Present value of the expected future stock price
Where:
- Dividend represents the expected future dividend payment in each period.
- Discount Rate is the required rate of return by investors.
- ‘n’ is the number of periods into the future.
However, it is difficult to predict the dividend for each year accurately. Many analysts assume that the company's EPS will grow at a constant rate and will pay a constant percentage of its EPS as a dividend.
Example: DDM
Let's consider a company, DEF Ltd., whose current EPS is Rs. 20 and P/E ratio is 10, i.e., the market price is Rs. 200. Assuming that EPS is going to grow at the rate of 10% and the company is giving 10% of the EPS as dividend. The future EPS and dividend payout will be as follows:
|
Year |
EPS |
Dividend amount |
|
0 |
20.00 |
2.00 |
|
1 |
22.00 |
2.20 |
|
2 |
24.20 |
2.42 |
|
3 |
26.62 |
2.66 |
|
4 |
29.28 |
2.93 |
|
5 |
32.21 |
3.22 |
Assume the discount rate is 8%. If you expect that P/E also grows to 15 in five years, the future expected price will be EPS*P/E = 32.21*15 = Rs. 483
We can calculate the present value of the dividend and future price as below:
Year 1: 2.20 / (1 + 0.08)^1 = 2.04
Year 2: 2.42 / (1 + 0.08)^2 = 2.07
Year 3: 2.66 / (1 + 0.08)^3 = 2.11
Year 4: 2.93 / (1 + 0.08)^4 = 2.15
Year 5: 3.22 / (1 + 0.08)^5 = 2.19
PV of future stock price: 483 / (1 + 0.08)^5 = 328.72
The sum of these present values is 2.04 + 2.07 + 2.11 + 2.15 + 2.19 + 328.72 = 339.29
Therefore, the intrinsic value of DEF Ltd.'s stock, based on the DDM, is approximately 339.29 per share.
The Comparable Company Analysis method estimates intrinsic value by comparing the target company to similar publicly traded companies in the same industry. This approach uses financial multiples such as P/E ratios, P/S ratios, or EV/EBITDA ratios.
Example: Comparable Company Analysis
Consider XYZ Inc., a publicly traded company in the technology sector. The average P/E ratio for similar companies in the industry is 20. XYZ Inc. has an EPS of Rs.3.50.
Intrinsic Value = 20 (average P/E ratio) x 3.50 (EPS) = Rs.70
According to this method, the intrinsic value of XYZ Inc.'s stock is Rs. 70 per share.
Read More: How to Calculate Valuation of the Company
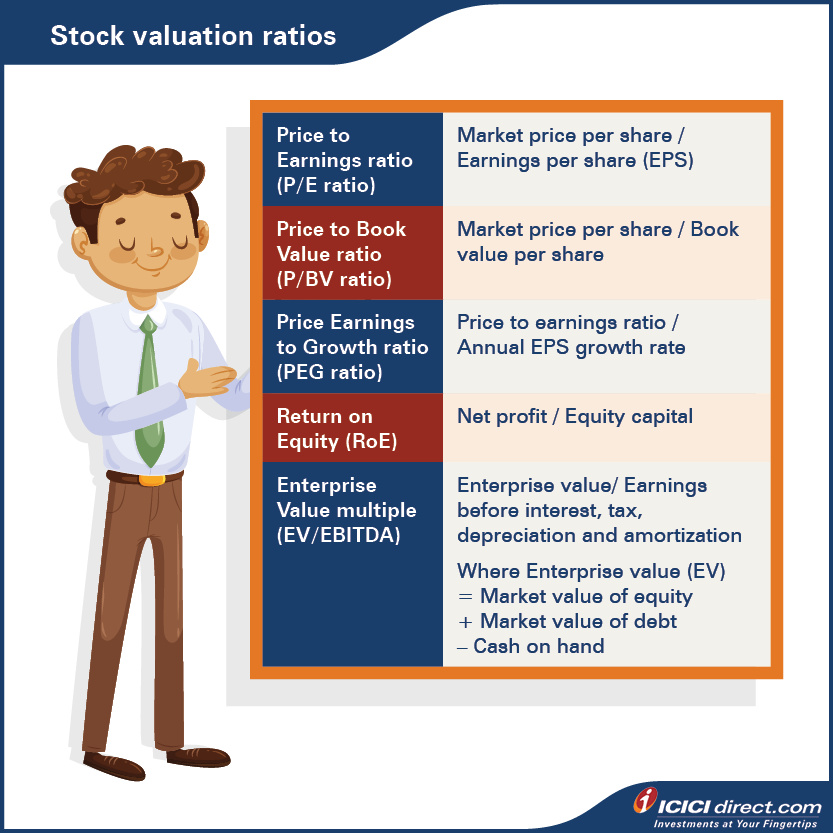
You can refer to this infographic to learn a few more fundamental indicators for choosing stocks for investments.
Calculating the intrinsic value of a stock is a fundamental skill for investors seeking to make informed investment decisions. While various methods are available, each has its strengths and weaknesses. It's essential to understand that intrinsic value is not a fixed number but an estimate based on assumptions about the company’s growth, market conditions, cost of capital and other factors that may affect its cash flows. As these assumptions require a great degree of expertise and management view, many investors follow the view of qualified analysts to know the future price of a stock.
As an investor, you can use a simple approach to calculate a company's intrinsic value. Multiply the company's earnings per share (EPS) with the average price-to-earnings ratio (P/E) of leading companies in the same industry. This will give you a good idea of the right price multiple, as the average P/E considers both price multiple and industry growth.
However, keep in mind that a company's growth rate may be different from the industry average, so the P/E can be adjusted accordingly. For instance, if the average P/E of leading companies is 20, and the industry growth rate is 15%, but the company you're interested in is growing at 25% per annum, you can use the P/E-to-growth (PEG) ratio to find the right P/E. In this case, the PEG ratio should be the same for both the leading companies and the company you're interested in.
In this case, the PEG ratio of leading companies is 20/15 = 1.33, then the right P/E of the company you're interested in would be 25*1.33 = approximately 33. However, it's essential to remember that a company's high growth rate may not be sustainable in the long term, and the market may adjust the price multiple if a company's growth falls in the future.
Additional Watch: All about PE Ratio
Additional Watch: How to value a stock before buying?
Gold can react to inflation data, while crude oil may jump after an inventory report or geopolitical disruption.
Understand how crude oil trading works on MCX and also learn about contract sizes, expiry, trading hours, global benchmarks, price drivers and risks before you trade.
Learn how to calculate the break-even point in commodity trading by factoring in brokerage, taxes, and other charges


Elevate Your Financial Knowledge with the
ICICI Direct iLearn App
Elevate Your Financial Knowledge with the
ICICI Direct iLearn App
