







Download
iLearn application
Elevate Your Financial Knowledge with the
ICICI Direct iLearn App





In a range-bound market, the price of a stock bounces back and forth. It creates identical, or nearly identical, highs and lows, establishing a lower support level and an upper resistance level.
The upside potential of trading in a range-bound market may not be exciting for a trader looking to ride on a trend. But the relative predictability of these highs and lows indicates the opportunity of earning money, though in smaller quantities.
When an index or stock trades between a support level and resistance level, it is known as range-bound. Support level refers to a price level from which an asset does not fall below over a period. Resistance level refers to the price at which an asset meets pressure while rising. It is short-lived and caused by an increasing number of sellers desiring to sell the security at that price.
The price movement in a range-bound market is not strong in any direction. The prices move close to the old highs and then drop to prior lows. The range-bound movement trend breaks when a significant move has ended the existing support and resistance level. At this time, the bears and the bulls try to dominate the direction of the next movement.
To identify a range-bound market, you can utilize the technical or FNO indicators. Indicators like ADX, Bollinger Bands or PCR etc. can be used to identify the range-bound market.
When the ADX is below 25, the market is said to be ranging. As the ADX value rises to cross 25, it indicates that the market is ready to step into a trend phase - bullish or bearish.
Volatility is low when the bands (14 periods with Standard Deviation 1) are thin and contracted. The price does not move a lot in one direction. But with expansion in bands, volatility increases, and there are chances of the price moving fast in one direction.
It is a period of the range-bound market when the PCR OI ranges between 0.95 and 1.05.
Additional Read: Options Module
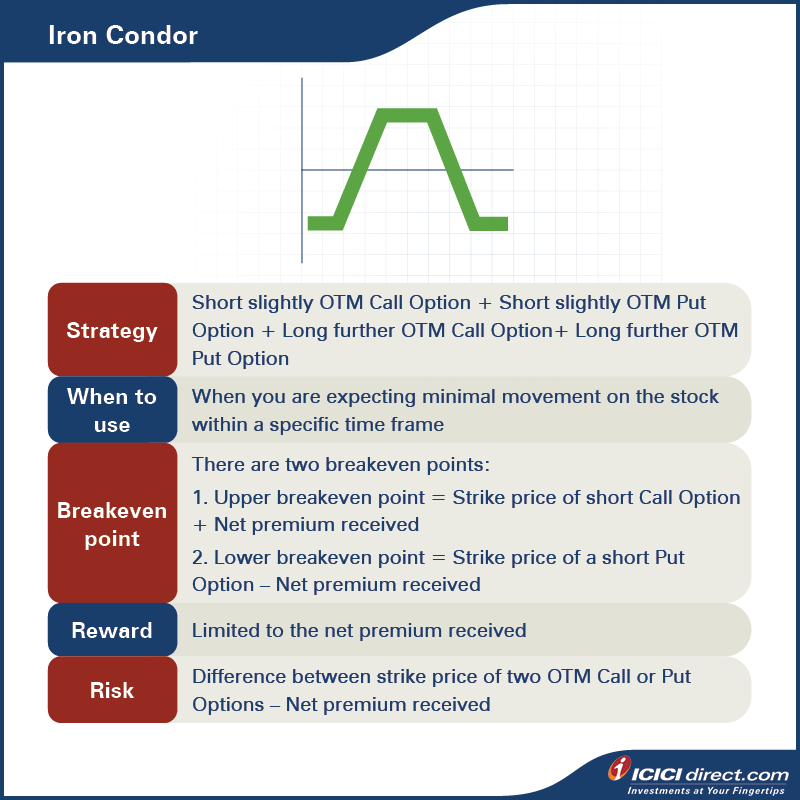
For establishing an iron condor, a trader would sell both an out-of-the-money (OTM) put and call, and at the same time, buy a further OTM put and call. The maximum profit in this strategy is limited to the net premium received. The maximum loss could be the difference between the two call or put options strike price minus the net premium received.
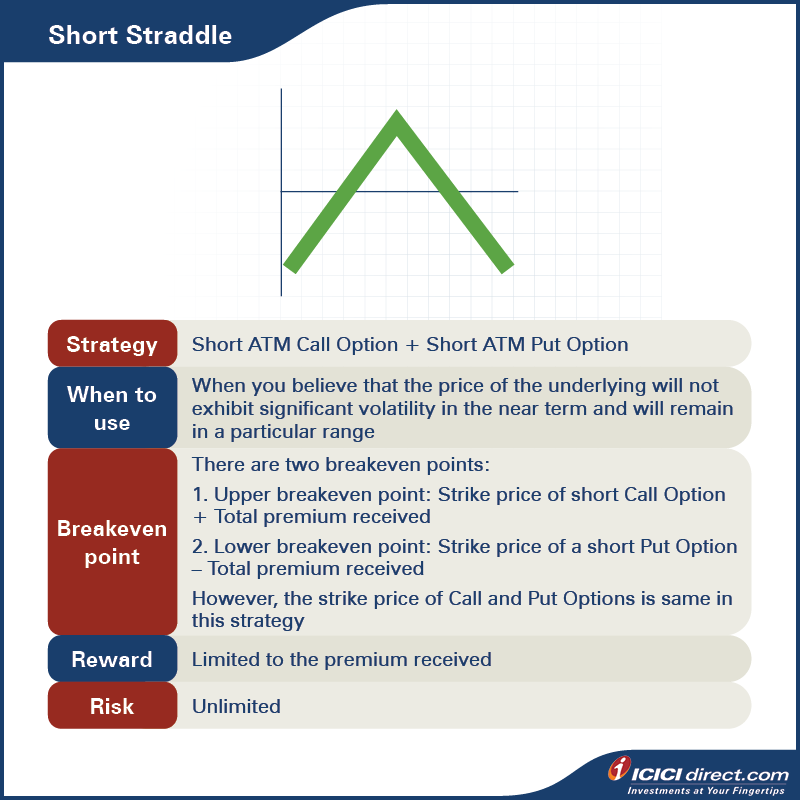
In Straddle, the trader shorts an ATM call and put option.
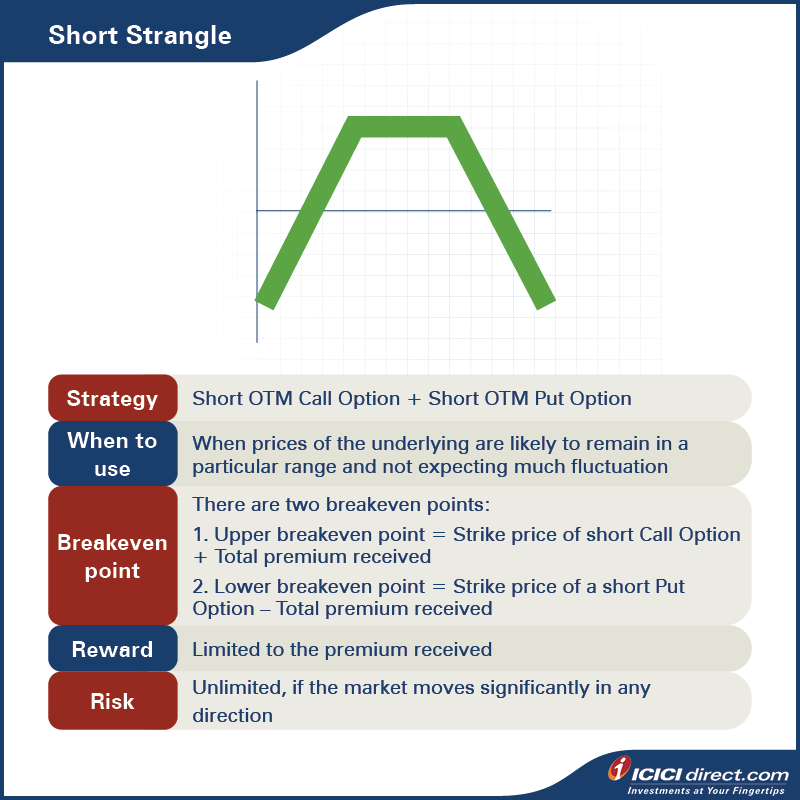
If traders expect a broader range, they can short OTM call and put options. In both strategies, profit is limited to the premium received, while a loss could be unlimited.
A phase of price consolidation is known as a range-bound market in which the price of a stock undergoes sideways movement. There are many indicators to help you identify a range-bound market. Iron Condor and a Straddle or a Strangle could be good strategies for a range bound market. Investors and traders must apply an option strategy in the market only after understanding their risk.


Gold is one of the world's most actively traded precious metals and is widely used for investment, jewellery and industrial applications. It is also considered a safe-haven asset during periods of economic or market uncertainty.
 343 views
 3 minutes
 07 Sep 2026
In this article, we’ll explore the three exchanges that matter most: NYMEX, COMEX, and the London Metal Exchange (LME) and their link with MCX.
514 views
1 minutes
31 Aug 2026
Explore the meaning of a mainboard IPO, SEBI's eligibility routes, NSE and BSE listing rules, key benefits, and the checks investors should make before applying.
2 k views
4 minutes
13 Aug 2026

Elevate Your Financial Knowledge with the
ICICI Direct iLearn App
Elevate Your Financial Knowledge with the
ICICI Direct iLearn App
