


MARKET INSIGHTS
We appreciate your patience. Your content is on the way.
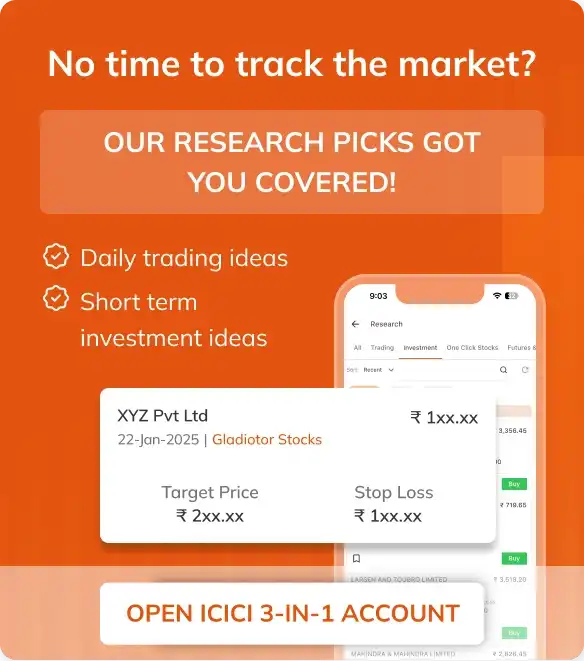
Looking for expert-backed stock recommendations? ICICI Direct Equity Research Team provides valuable insights and analysis to help you make informed investment decisions.
 Stock Screener
Stock Screener: A smarter way to access the market every day! With just one go, these screeners help you identify stocks based on predefined conditions or trends as per your requirements.
We appreciate your patience. Your content is on the way.
 Videos
  Podcasts
  Equity Research FAQs
We appreciate your patience. Your content is on the way.