What to expect from 2023? Detailed analysis
2022 has been an excellent year for Indian equity investors, especially if you consider how other major world economies performed in 2022. The benchmark indices, SENSEX and NIFTY, ended the year 4.4% and 4.3% higher, while indices like FTSE (UK) reported (a 0.4%) loss, Dow was down 9.2%, and Hang Seng lost 15.8%.
What to expect from 2023? Let us look at how the domestic market will shape up in 2023.
Kudos to Indian investors
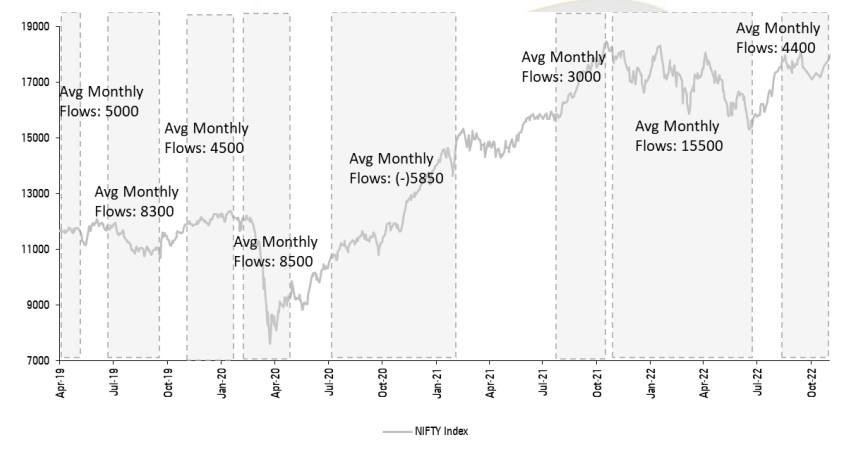
Buying the dips can be ideal for investors as they can enter certain stocks at lower prices. It means top-up your investment when the market is falling and continuing SIPs in a normal market situation. Investors have failed to do this in the past, but in 2022 - we see Indian investors were able to implement this teaching. How do we know?
Every time the market fell in 2022, the average monthly investment by domestic mutual fund investors was higher compared to the preceding months. On the other hand, when the market recovered (or rallied), investors put in a lower amount.

Source: Bloomberg, AMFI
India v/s Global
When it comes to the overall market outlook, one parameter investors look at is the PE ratio. It helps evaluate whether the market is overpriced or under-priced. In 2022, investors and experts debated - should the Indian market correct more because of its premium valuation. We will look at the valuation and draw some conclusions.
NIFTY's past 10-year average PE is 17.1x. However, on a one-year forward basis, NIFTY is currently trading at ~19x PE - which is expensive (11% premium). Compared to this, the global peer S&P500 currently is trading ~18.3x on one-year forward PE. Its 10-year forward PE average is 20.3x (10% discount).
Why the difference between the two indices? The crucial question is what is driving the disconnect. Let us try and understand this in simple terms:
- GDP Growth Outlook: Not only domestic but also FII are ready to invest in the Indian market despite a premium valuation is higher GDP growth in 2022 and a higher outlook in 2023. In India, GDP is expected to be 6.8% and 6.1% for 2022 and 2023, respectively. On the other hand, the GDP numbers for the US are comparatively lower - 1.6% and 1, respectively. You can check our blog on GDP significance HERE.
- Corporate earning trajectory: In the last three years (FY20 to FY22), Indian corporate earnings grew at a CAGR of ~28% CAGR and are expected to grow at 15% CAGR in the coming years. The US grew at 12% between FY19 and FY21, while it is expected to grow at 10% CAGR.
- Inflation: Inflation is high in India but better than in the US. The last reported inflation was 5.9%, above the target level of 4% but well below the upper tolerance. The US Fed reported last inflation at 7.9%, which is well above the target levels of 2% and upper tolerance levels of 4%.
Based on the above parameters, we can explain the premium valuation trajectory of the Indian equity market.
How are smallcap and midcap expected to perform in CY23?
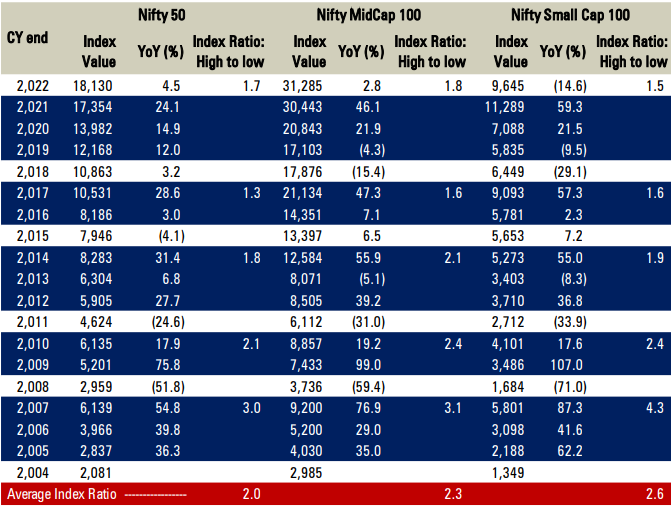
If we look at small and midcap space for the last two decades, we can see that markets run a block of two to four years before hitting an interim low or witnessing a correction - check the table below. For example, a block of the run was between 2019 and 2021, and another one was between 2012 and 2014 (marked in blue).

Source: Bloomberg, ICICI Direct Research
We will use the index value ratio to understand if the market will underperform or outperform in CY23. An index value is a ratio that describes a change in a nominal value relative to its value in the base year. From the data, we can find a trend in the index value ratio - from high to low index value in a block period.
Let us first calculate the average index ratio for small and midcap indexes and compare it with NIFTY50:
- Average index ratio of NIFTY 50 - (1.3 + 1.8 + 2.1 + 3.0) = 2.0
- Average index ratio of NIFTY Midcap 100 - (1.6 + 2.1 + 2.4 + 3.1) = 2.3
- Average index ratio of NIFTY Smallcap 100 - (1.6 + 1.9 + 2.4 + 4.3) = 2.6
These are the average index ratio for the upcycle block. Based on this, we can conclude that in an upcycle, the return in smallcap- is greater than midcap (2.6 > 2.3), which is still ahead of a large cap (2.3 > 2).
For 2022, the Index ratio for NIFTY50, Midcap 100, and Smallcap 100 are 1.7x, 1.8x, and 1.5x, respectively. It is below the average value.
Therefore, we can say that we can expect ~20% upside in NIFTY50 ((2 - 1.7)/1.7), ~30% upside in Midcap ((2.3 - 1.8)/1.8)) and ~70% upside in Smallcap ((2.6 - 1.5)/1.5)). Based on these numbers, we expect small cap & midcaps to outperform the Nifty Index over the next two to three years, starting CY23E*.
E in CY23E denotes Estimated
Market outlook for CY23E
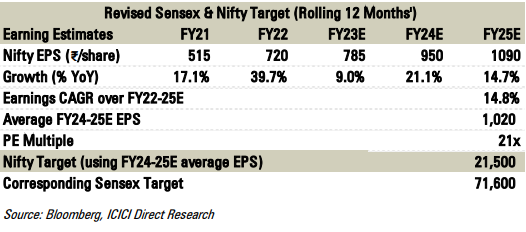
Nifty earnings over FY18-21 were seen at ~Rs 450-500 levels (EPS of NIFTY). Post rebasing, Nifty earnings are seen growing at ~15% CAGR in FY22-25E (table below).

The growth is primarily driven by
- improved asset quality and credit growth revival in index-heavy BFSI space
- pick-up in capex activity and consequent execution in the capital goods domain
- margins & profit recovery in auto, FMCG, metals, pharma, and oil & gas space
The average Earning Per Share (EPS) is taken at Rs 1,020, and based on that NIFTY target is set at 21,500 @ 21x PE on FY24-25E, it offers a healthy upside of approximately 19% from current levels.
Themes for CY23
Electrification: The trend is picking up pace more swiftly than expected, with domestic aggregate penetration now pegged at ~5% in YTDCY22. Electrification is further gaining traction as different players have committed ~$15+ billion CAPEX spend amid a supportive government policy framework. Capex is led by both listed (Tata Motors, M&M, TVS Motors, etc) and new-age OEMs, with prominent names being Ola Electric, Ather Energy, and Hero Electric, among others.
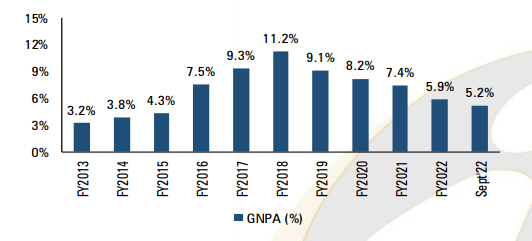
Banks: The banking sector peaked at Gross Non-Performing Asset (GNPA) in FY18. However, post that the GNPA has come down (image below). The falling NPA has led to an outperformance of banks in the recent past. High capital adequacy (CAR, the ratio of a bank's capital to its risk) and a strong coverage ratio result in lower risk aversion from lenders. The retail/MSME segment has been a key driver of credit offtake and will continue to remain so.

Defense sector: Total opportunity size for domestic defense players is estimated at over Rs 5 lakh crore in the next five years (FY23-27E), driven by a focus on procurement of modernized indigenous platforms and arising export opportunities from friendly countries.
FMCG: Major commodity prices witnessed unprecedented upward movement in 2021 and H1FY22. Palm oil & crude moved up 2-3x from pre-Covid levels until May 2022. After peaking in H1FY23, crude & palm oil have dipped 30-50%. With this, it is expected that the gross margins of FMCG companies have bottomed out in Q2FY23 while a sequential improvement is imminent. FMCG companies are expected to increase grammages for low unit packs (LUPs) to pass on the benefit of a commodity dip, which would help restore rural volume growth in FY24. Higher than minimum support prices (MSP) would aid rural income levels and, in turn, demand for FMCG products.
Other sectors that are expected to perform well
- Taking into account the expansion plans of large cement players, we expect net industry capacity to grow at a CAGR of 6% in the next three to four years.
- We are expected to become a gas-dependent economy. As per media reports, by 2026, India will invest Rs 3 lakh crore to expand its gas infrastructure - pipelines, LNG terminals, CGD networks, and gas exploration projects. It would help with the government’s aim to raise the share of natural gas in its energy mix to 15% from the current 6.7%.
- For the real estate sector, the funding crunch, and weak environment in the last couple of years, have meant the exit of small/marginal unorganized players, which has resulted in a sharp market share expansion for top players. With less competition and well-placed balance sheets, we expect top developers to remain the key beneficiaries of this upcycle.
- With 5G, telcos treading a robust growth trajectory in the medium term with overall industry structure being favorable, along with a chunk of the capex cycle, already done and under process currently. We continue to remain constructive on the top two telcos, given their relatively strong competitive position.
Our Top picks for CY23
Kajaria Ceramics
Target price: Rs 1,340
We expect ~12% CAGR in tiles volume and realizations CAGR of 3.4%, resulting in tiles revenues CAGR of ~16% over FY22-25 to Rs 5237 crore. Margins are also reverting to a historical average of 16% in FY24, with softening gas prices.
Risks: Gas price volatility, demand moderation.
Sterlite Technologies
Target price: Rs 220
With a renewed focus on ramping down/exiting the loss-making segment and focusing on improving the services segment profitability, STL will likely see an improvement in earnings momentum ahead.
Risks: Volatility in the margin, continued leverage.
Maruti Suzuki India
Target price: Rs 11,200
MSIL is well placed to play upon the underpenetrated PV segment domestically. We build 16.6% volume CAGR, 24.7% revenue CAGR, and 67.6% PAT CAGR for MSIL over FY22-24E.
Risks: Covid led slowdown in demand and adverse currency moves i.e. unexpected appreciation of the Yen vs. rupee.
Mahindra CIE Automotive
Target price: Rs 410
We build 14.7% sales CAGR over CY21-24E along with an uptick in margins to 12.8% by CY24E. At the current market price, it trades at ~13x P/E on CY24E EPS, with RoCE inching towards the ~14% mark.
Risks: Slowdown in the global economy and slower than anticipated margin recovery profile.
IndusInd Bank
Target price: Rs 1,450
We expect robust growth in earnings at Rs 9,652 crore and RoE at ~15% in FY25E, though focus on distribution capabilities and tech spending to keep opex elevated in the near term. At the CMP, the bank is trading at 1.4x FY25E.
Risks: The slower pace of liabilities accretion could impact NIM; moderation in earnings momentum led by elevated opex (operational expenditure).
HDFC AMC
Target price: Rs 2,600
Tech investments, business promotion activities, and new launches to keep opex elevated in the near term but should reflect in business growth.
Risks: Elevated redemption in non-SIP AUM and increase in competitive intensity impacting yields.
Nesco
Target price: Rs 800
The prudent management pedigree, steady & planned expansion across verticals funded largely through internal accruals, and niche profitable business model including foods/own events, etc make it likable.
Risks: Any further Covid wave and any exit and failure to release in commercial business.
V-Guard Industries
Target price: V-Guard’s revenue is likely to grow at a CAGR of ~17% over FY22-25E led by new product launches (post Sunflame acquisition) and dealer expansion. The EBITDA margin is likely to expand by ~130 bps over FY22-25E led by an improved sales mix and cooling of raw material prices from its peak.
Risks: Slow rural demand and reversal in commodity prices may delay margin recovery.
Reliance Industries
Target price: Rs 3,050
We expect the ARPU and EBITDA of Jio to grow at ~12%, and ~22%, respectively, over FY22-25E. On the O2C front, Singapore GRMs, which had declined during the start of Q3 have started improving amid a rise in product cracks and are at ~$9/bbl.
Risks: Lower discretionary spending owing to higher inflation can subdue sales and lower-than-expected refining margins.
Disclaimer: ICICI Securities Ltd. (I-Sec). Registered office of I-Sec is at ICICI Securities Ltd. - ICICI Venture House, Appasaheb Marathe Marg, Prabhadevi, Mumbai - 400 025, India, Tel No : 022 - 6807 7100. I-Sec is a Member of National Stock Exchange of India Ltd (Member Code :07730), BSE Ltd (Member Code :103) and Member of Multi Commodity Exchange of India Ltd. (Member Code: 56250) and having SEBI registration no. INZ000183631. AMFI Regn. No.: ARN-0845. We are distributors for Mutual funds. Mutual Fund Investments are subject to market risks, read all scheme related documents carefully. Name of the Compliance officer (broking): Ms. Mamta Shetty, Contact number: 022-40701022, E-mail address: complianceofficer@icicisecurities.com. Investments in securities markets are subject to market risks, read all the related documents carefully before investing. The contents herein above shall not be considered as an invitation or persuasion to trade or invest. I-Sec and affiliates accept no liabilities for any loss or damage of any kind arising out of any actions taken in reliance thereon. Such representations are not indicative of future results. The securities quoted are exemplary and are not recommendatory. Please note, Mutual Fund related services are not Exchange traded products and I-Sec is just acting as distributor to solicit these products. The contents herein above are solely for informational purpose and may not be used or considered as an offer document or solicitation of offer to buy or sell or subscribe for securities or other financial instruments or any other product. Investors should consult their financial advisers whether the product is suitable for them before taking any decision. The contents herein mentioned are solely for informational and educational purpose.


