
What is comparative relative price indicator?
Imagine you're interested in buying a new smartphone, but you're not sure which one to choose. You've narrowed it down to two options: the iPhone and the Samsung Galaxy. You've done some research on both phones, but you're still not sure which one is the better choice.
One way to come to a decision is to compare the performance of the iPhone and the Samsung Galaxy based on their features, price, and other factors that are important to you.
For example, let's say the iPhone costs 1,00,000, while the Samsung Galaxy costs 80,000. If you would divide the price of the iPhone by the price of the Samsung Galaxy, it gives you a value of 1.25. This means that the iPhone is more expensive than the Samsung Galaxy by a ratio of 1.25 to 1.
Now, let's say that you value camera quality and battery life the most in a smartphone. After doing some research, you find that the Samsung Galaxy has a better camera and longer battery life than the iPhone. Based on this analysis, you may consider buying the Samsung Galaxy since it is outperforming the iPhone in the areas that are most important to you.
What you have just done is run a comparative relative strength (CPI) analysis to compare the performance of two options and see which one is outperforming the other.
In stock markets, the CPI can help you in narrowing down your investment options by providing you with a way to compare the performance of different assets. By using the CPI to compare the relative strength of two assets, you can identify which one is performing better and consider investing in that asset.
Comparative Relative Strength(CPI) is an indicator that compares the performance of one security to another with a ratio chart. This indicator is also known as the Price Relative indicator or Comparative Price Indicator or Relative Strength Comparative. It's a useful tool for traders and analysts who want to gain insight into market trends and identify potential trading opportunities.
The presumption behind the concept of comparative relative strength is that strength of a stock over the other will continue, similar to how a trend will continue, and that by recognizing the strongest investments, an edge can be obtained by investing in them until their strength abates.
Caution: Comparative relative strength is not to be confused with the more common Relative Strength Index(RSI). RSI is an indicator that measures the strength of price action in a particular market. RSI indicates if the stock or security is overbought or oversold relative to its past price action over a specific period of time. You can learn more about RSI here.
Calculation of Comparative Relative Strength
The Comparative relative strength indicator is simply a ratio that is calculated by dividing the price of one security or market index by the price of another security or market index. The resulting value indicates the relative performance of the two securities or markets. If the CPI is in an uptrend, it indicates that the base security is outperforming the comparative security. If the CPI is in a downtrend, it indicates that the base security is underperforming the comparative security.
Comparative Relative Strength = Base security / Comparative security
- If CPI is in an uptrend -> Base security outperforming comparative security
- If CPI is in a downtrend -> Base security underperforming comparative security
For example, you can use the Comparative Relative strength to show the performance of TATA Motors relative to the Nifty50 which is the broader market index, or you can also compare the stock’s performance relative to its industry’s index, that is comparing it with Nifty Auto Index (CNXAUTO), or compare it with a competitor, maybe Maruti in this case. This would simply be the price of TATA Motors divided by the Nifty50 or CNXAUTO index or Maruti. Let's say we compare TATA Motors with Maruti. If the CPI is in an uptrend, it indicates that TATA Motors is outperforming Maruti, and you may consider buying TATA Motors stock. If the CPI is in a downtrend, it indicates that TATA Motors is underperforming performing Maruti, and you may consider buying Maruti’s stock.
The CPI can also be used to compare the performance of two indices, such as the Nifty Auto Index and the Nifty Bank Index. By comparing the performance of these two markets, you can get an idea of which sector is outperforming the other and which sector is favourable for investing right now.
So, to summarise, the Comparative Relative strength helps to identify whether a stock is outperforming or underperforming the benchmark index, sector or its peers.
Using CPI for analysis
The Comparative Relative Strength can be applied in a few different ways. We treat CPI's chart like any other stock chart, and we'll analyse it similarly to how we would any other security. To assess the direction of the CPI, you can use moving averages, support/resistance breaks, simple trend analysis, or other indicators. But, one of the most effective and profitable analyses is to look for bullish and bearish divergences in relative strength to look for a potential stock price reversal.
1. Trend analysis: You can use basic trend analysis to determine the CPI's direction. The CPI operates just like any other line chart, so all the support/resistance, trendlines, and breakouts that are appropriate for any price chart are also appropriate for the CPI. As a result, the CPI also exhibits uptrends and downtrends, which are discernible by higher highs and higher lows lower lows and lower highs, respectively.
2. Moving averages: You can also use a preferred moving average indicator for analysing the CPI chart. A basic observation is that the CPI may be in a long-term decline if it is trading below its 120-day SMA. Alternatively, if the CPI is trading above its 120-day SMA, an uptrend might be underway.
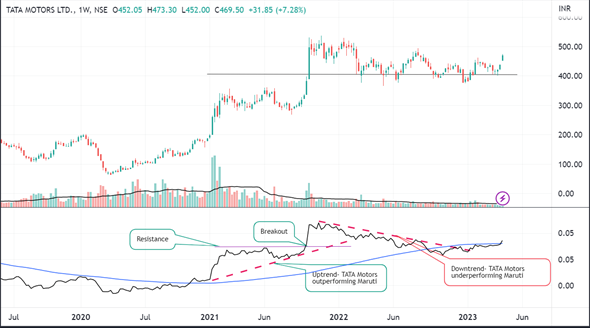
The chart above shows the weekly chart of TATA Motors (above pane) and the Comparative Relative Price of Maruti (TATA Motors/ Maruti) (below pane). A 150-day SMA is applied to both the TATA Motors price chart and the CPI chart. Notice that the CPI is in an uptrend since 2021, signalling the outperformance of TATA Motors compared to Maruti. However, after a major resistance breakout in Sep 2021, the price chart and CPI peaked in Oct 2021 and started forming lower highs and lower lows (downtrend). This downtrend indicates the underperformance of TATA Motors with respect to Maruti.
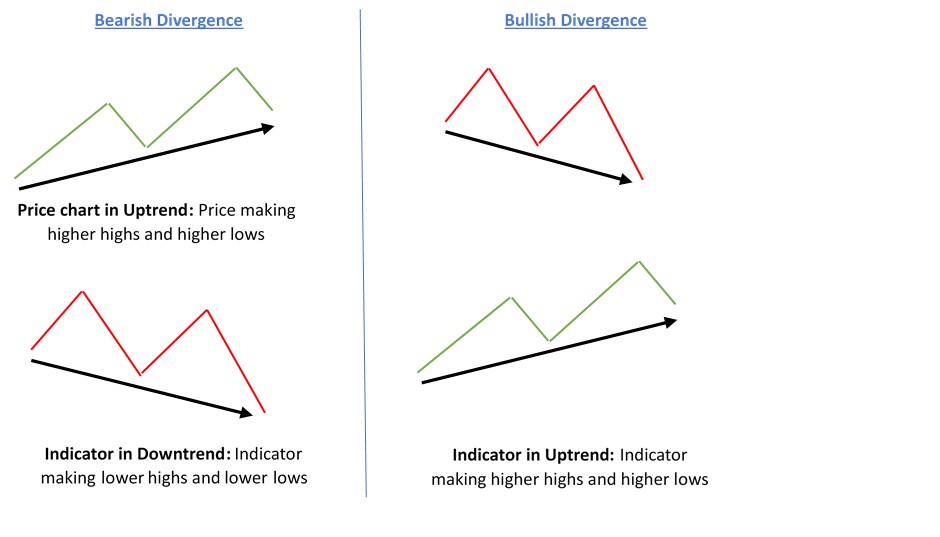
3. Bullish and bearish divergences: A bullish divergence in the CPI signals relative strength during a price decline. Alternatively, a bearish divergence in the CPI indicates weakness during an uptrend in the price chart of the stock. This approach is the most effective in analysing CPI and looking for potential reversal signs in the price chart of the stock.
What is a divergence, though, is a question you might ask.
Bullish and bearish divergences are technical analysis concepts used to identify potential trend reversals. These divergences occur when the price of a security moves in the opposite direction of a technical indicator. In our case, the technical indicator is the Comparative Relative Strength.
A bullish divergence occurs when the price of a stock is in a downtrend, but the technical indicator(here CPI) is forming an uptrend. This suggests that although the price is still in a downtrend, the momentum behind the price movement is weakening, and a potential reversal may be on the horizon.
On the other hand, a bearish divergence occurs when the price of a stock is in an uptrend, but the technical indicator (here CPI) is in a downtrend. This suggests that although the price is still in an uptrend, the momentum behind the price movement is weakening, and a potential reversal may be on the horizon.
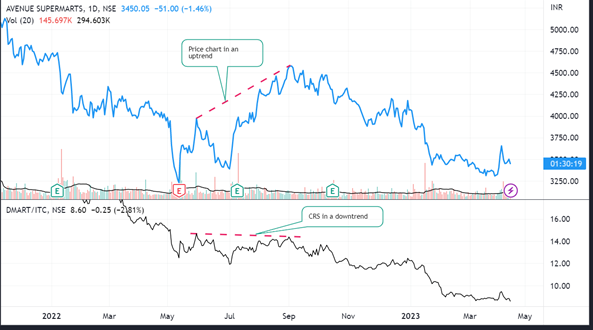
A bearish divergence in the Comparative Relative Price signals relative weakness during an uptrend in the price chart of the stock. For example, the chart above shows DMART with the Price Relative to ITC. As you can see the price chart of Dmart has been in an uptrend from May 2021 to Sep 2021, however, the price relative chart has been in an uptrend during the same period. This demonstrates that there was a bearish divergence because the price relative chart did not support the upward trend in the price chart. The two charts' bearish divergence is a warning indicator that the price of Dmart may be about to reverse. Notice that Dmart reached its high point on September 20, 2022, and it has since been in a decline, which is consistent with the trend in the price relative chart.
Bringing everything together
Suppose you are a conservative trader who prefers to put money into less risky and volatile sectors. The fourth-largest sector of the Indian economy, FMCG, is probably one of the safest bets for your investment. But did you know there are around 40 FMCG companies listed on the Indian stock exchange? It wouldn't be prudent to go over each company's fundamental and technical aspects because that would be time-consuming.
Therefore, in this case, CPI can be used in conjunction with fundamental analysis to filter out companies that are worse or better choices over others.
Let’s analyse 2 FMCG majors; ITC and Britannia through CPI and other technical analysis concepts.
ITC
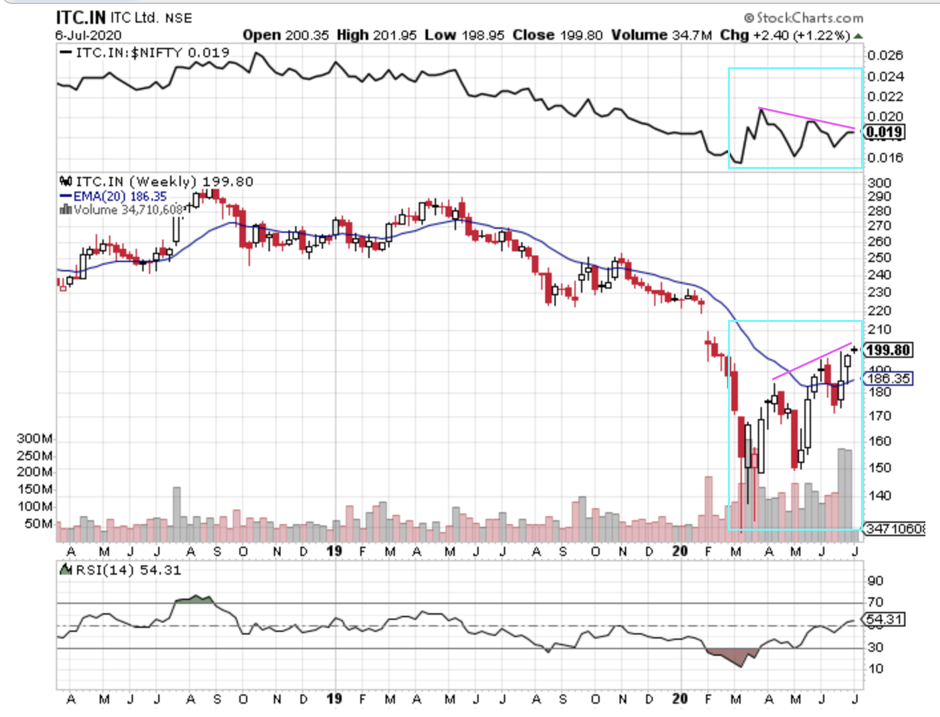
This is ITC’s weekly chart with the following indicators:
1. RSI(14 time period)
2. EMA(20 time period)
3. Price relative Indicator comparing ITC with Nifty50
Regardless of the uptrend in ITC since the big crash in March 2020, the Price relative Indicator is declining. This shows that even though the price of ITC is increasing, it is still underperforming the broader market,i.e.Nifty50.
We can see that a negative divergence has been formed (indicated by the pink line in the blue box), which gives us a confirmation that ITC’s upward rally will come to an end soon and the stock will correct soon.
The 20 EMA will give us confirmation on when to exit the stock or short the stock. When the price goes below the 20 EMA with an above-average volume, that is an indication that the stock will now go into a downtrend.
Britannia
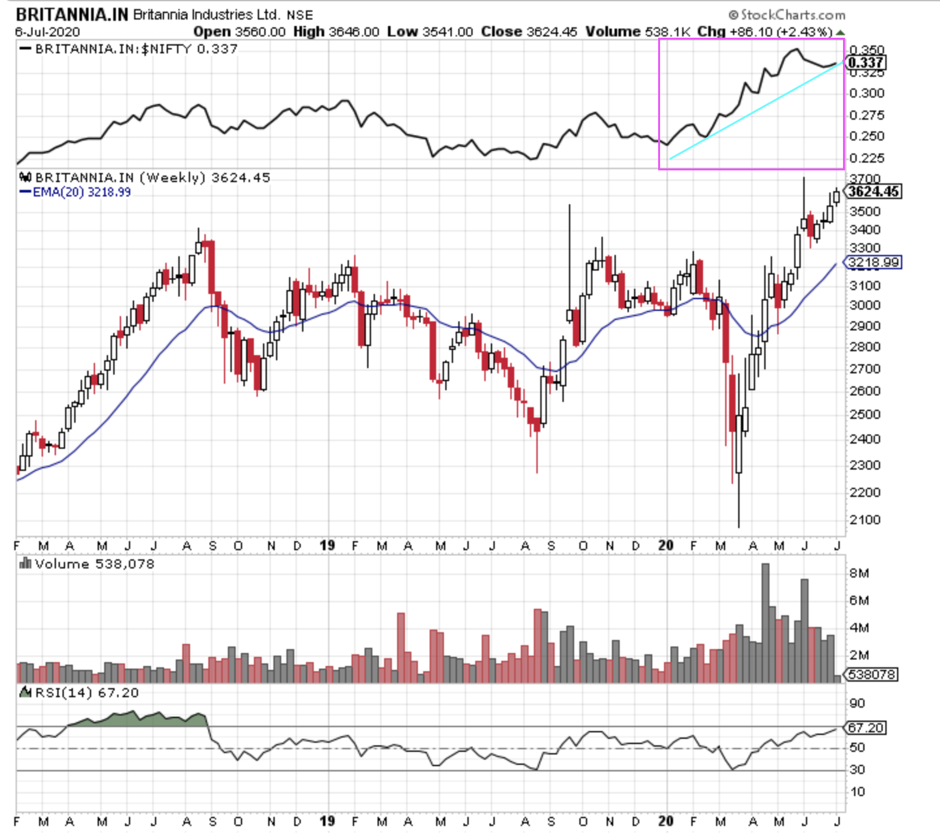
This is Britannia’s weekly chart with the following indicators:
1. RSI(14 time period)
2. EMA(20 time period)
3. Price relative Indicator comparing Britannia with Nifty50
Britannia has corrected almost 61% since 16th March 2020 and is trading at an all-time high now.
The stock has been moving in tandem with the Price Relative Indicator (here Nifty50) and is now outperforming the benchmark index Nifty50. Till the Price Relative Indicator drops to 0.300 (currently at 0.377) the stock will keep outperforming Nifty50 and will give good returns. This might happen when Nifty touches the 11,300 level and Britannia drops to 3390.
ITC v/s Britannia
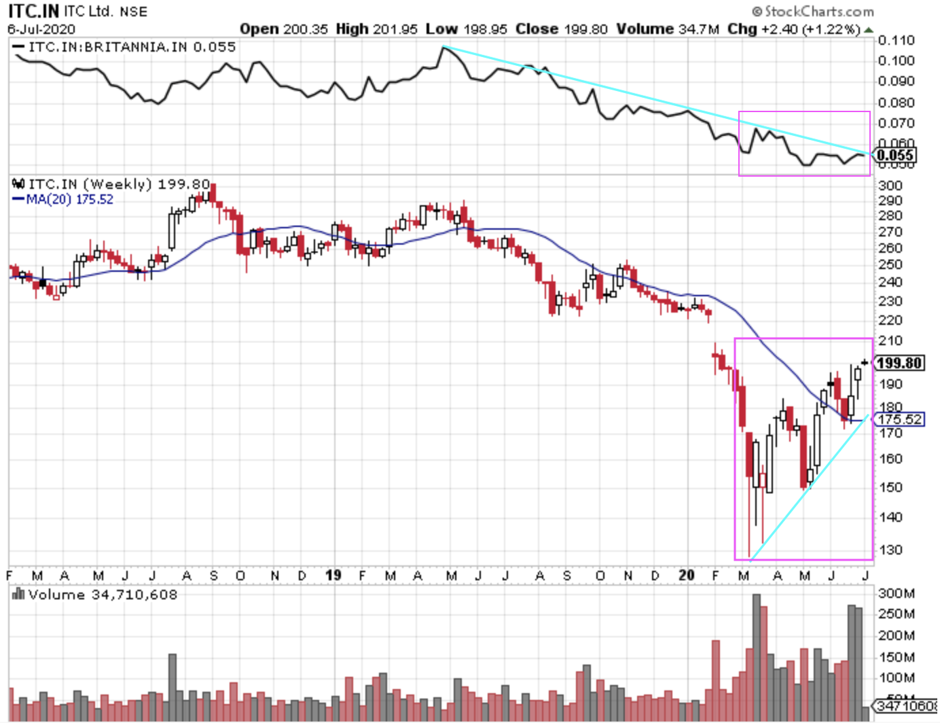
This is a weekly chart of ITC with the following indicators:
1. EMA(20 time period)
2. Price relative Indicator comparing ITC with Britannia
The Price relative Indicator here is comparing ITC with Britannia. We can clearly see a negative divergence (highlighted with the Pink box). This shows that even though ITC is in an uptrend, however relative to Britannia the stock has been underperforming.
The important factor to focus on here is that the Price relative Indicator is touching the Relative line (Light blue line) and ITC has finally managed to break above the 20 EMA line. If the Price relative Indicator manages to cross the Relative line and ITC sustains above 20 EMA with increasing volume then it will indicate a reversal. After analysing the two stocks on a lower time frame we will get the confirmation whether ITC will outperform Britannia now.
Conclusion
In this way, the CPI can help you narrow down your investment options by comparing the relative strength of different assets and identifying which one is performing better. However, it's important to note that the CPI should not be used in isolation and should be used in conjunction with other indicators and analysis to make informed investment decisions.
Source: stockcharts.com, TradingView


