
Earnings wrap for Q3FY23 - Detailed Analysis
The earning season is almost over, as most companies have already reported their Q3FY23 (Oct-Dec) quarter earnings. If we look at the overall picture, it was a good quarter for the Indian companies as the earning was resilient and margins expanded, which led to healthy double-digit sequential growth (QoQ). Let us look at how the different sectors performed in the third quarter.
Q3FY23: Key Highlights
Below are the key highlights for Q3FY23 that investors should know:
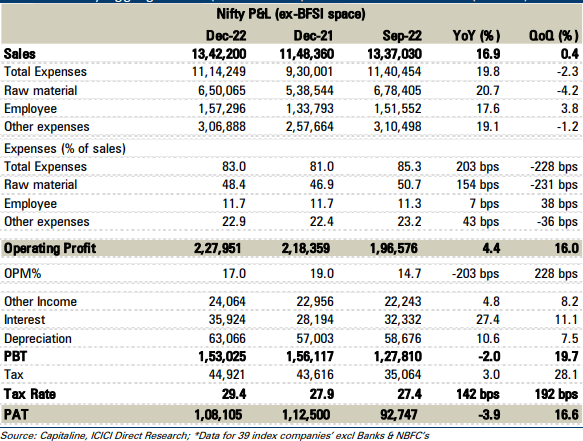
- Margin recovery: Nifty operating margins increased 230 basis points to 17% QoQ. The growth was led by savings realized from lower raw material costs.
- Sequential performance: On an aggregate basis, NIFTY's topline (revenue) for Q3FY23 was flat sequentially at Rs 13.4 lakh crore. EBITDA (Earnings Before Interest, Taxes, Depreciation, and Amortisation) was up 16% (QoQ) at Rs 2.3 lakh crore, and PAT (Profit After Tax) jumped 16.6% at Rs 1.1 lakh crore.
- Performance YoY: On a YoY basis, the Nifty topline was up 16.9% YoY. However, PAT was down 3.9%, primarily tracking muted profitability in the commodity space - metals and oil & gas domain.
- Management commentary: Management commentary across businesses was positive on the demand outlook.
NIFTY and Sensex target post Q3FY23 earnings
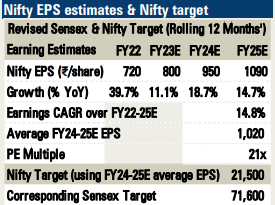
ICICI Direct's Nifty EPS does not undergo any major change post Q3FY23 result. We still expect Nifty earnings to grow at a CAGR of 15% over FY22-25 with our fair value for Nifty at 21,500 - 21x PE on FY24-25E average Nifty EPS of Rs 1,020. The corresponding Sensex target is 71,600. These are our 12-month’s rolling index targets.
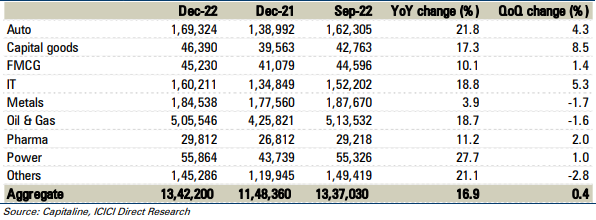
Sector-specific takeaways
Auto & Auto Ancillary
- In the auto space, the results were largely ahead of our estimates, and healthy margin recovery took center stage as most players benefitted from the raw material price decline.
- The companies we covered reported a gross margin expansion broadly in the range of 50 to 300 basis points sequentially, with auto OEMs outperforming the auto ancillary space due to better economies of scale.
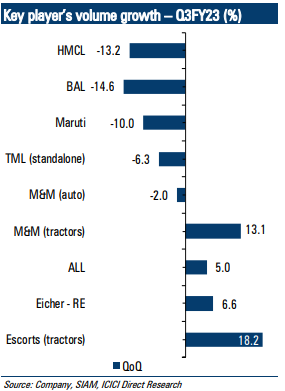
- In the auto OEM (original equipment manufacturer), M&HCV space outperformed the rest of the pack with QoQ volume recovery. On the margins front, Bajaj Auto led the sector with a robust margin uptick aided by commodity benefits and strategic premiumization initiatives and price hikes & healthy dollar realization.
- The 2-W space reported muted QoQ volumes, especially in the entry-level segment, whereas the premiumization trend played well.
Below is the company-level performance:
- Maruti Suzuki India Ltd (MSIL) margins were largely on expected lines (at 9.8%) with PAT beat due to higher ASPs and higher other income. The management guided for strong demand for newly launched models in UV space with an order book at 3.6 lakhs units. The key takeaway was its intent to reduce pending order books via production ramp-up.
- Tata Motors’ Q3FY23 results surprised the Street by turning profitable for the first time during the year. The key positive was the sequential margin uptick in all key segments. CV (Commercial Vehicle) business reported EBITDA margins of 8.4% (up 340 bps QoQ), while the same in the PV business was at 6.9% (up 150 bps QoQ).
- Apollo Tyres outperformed its peers in terms of gross margin expansion, which was up ~300 bps QoQ on a standalone basis. EBITDA margins at the consolidated level came in at 14.2%, up 227 bps QoQ. Management commentary about demand from the replacement segment and the European region remained cautiously optimistic.
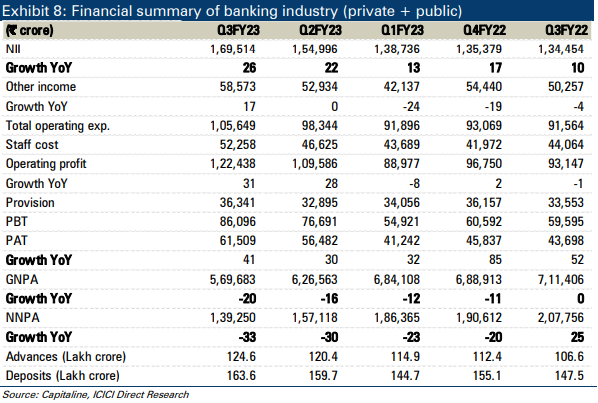
Banking Sector
- In Q3FY23, the banking sector continued its strong performance on earnings led by both - sustained momentum in business growth and a further improvement in margins.
- Continued improvement in asset quality further aided profitability and return ratios. Strong credit demand has been witnessed from retail (within retail, unsecured books witnessed robust traction) and the MSME (Micro, Small & Medium Enterprises) segment coupled with improvement in corporate demand.
- Loan growth remained healthy at 15.3% YoY at Rs 132 lakh crore (as per RBI). Though the same has come down compared to the previous two months (17.6% YoY in November 2022 and 18.3% YoY in October 2022) due to the base effect.
- Banks’ focus on the high-yielding unsecured retail segment (personal loans + credit cards + MFI) is on the rise, with the proportion of the same increasing approx. 100 bps in the last four quarters.
- NII grew at a strong pace of 26.1% YoY and 9.4% QoQ, mainly driven by healthy business momentum and margin expansion. Other income grew 10.7% QoQ, 16.5% YoY partly aided by treasury gains and healthy recovery from written-off accounts.
- C/I ratio (cost to income ratio measure looks at the cost of running operations as to a bank's operating income) moderated by 98 bps QoQ to 46.3% vs. 49.6% in Q3FY22, mainly on account of a strong topline.
- Credit cost for the quarter was largely steady on a sequential basis due to better asset quality performance and controlled slippages. Thus, the growth trajectory in earnings remains strong. Led by a strong topline and controlled credit cost, net profit grew 40.8% YoY and 8.9% QoQ at Rs 61,509 crore.
- PSU banks continued to put up a relatively superior performance in Q3FY23 when compared to private peers.
- Asset quality trend continued to improve with GNPA (Gross Non-Performing Asset - a total of all the loan assets that haven't been repaid by the borrowers within the ninety days) ratio at industry level declining ~60 bps QoQ at ~4.6%. Even on an absolute basis, GNPA declined 9.1% QoQ, 19.9% YoY. The restructured book also declined ~10-40 bps QoQ for most banks.
Our View: On valuations, we expect a selective approach with a preference for lenders with healthy liabilities franchise, higher floating rate assets, adequate PCR, and capital.
Deposit mobilization (especially CASA deposits) and thus trend in CD ratio (Credit-Deposit ratio tells us how much of the money banks have raised in the form of deposits has been deployed as loans) would need to be watched.
Capital Goods
- Our capital goods coverage companies delivered a healthy performance aided by strong execution with strong order inflows. While supply chain disruptions, higher freight costs, and higher commodity prices continued to impact margins, the favourable impact of recent commodity price correction brings in, much-needed relief, going forward.
- Revenue for coverage of our universe grew 8.7% on a YoY basis while EBITDA marginally de-grew 0.7% YoY. Consequently, adjusted PAT grew 8.8%, YoY partly aided by positive operating leverage, and other income.
- Aggregate revenue growth of our coverage companies under defense remained lower marginally by ~1% YoY. The Aggregate EBITDA of the defense coverage companies de-grew 16.5% YoY as the average EBITDA margin contracted considerably by 353 bps YoY to 18.9% in Q3FY23.
- EBITDA margin contraction was led by BDL, HAL & BEL, which saw a YoY decline of 1674 bps, 682 bps, and 160 bps, respectively, mainly led by a sharp rise in other costs as gross margin for all three improved considerably YoY.
Our View: As companies almost resumed to pre-pandemic levels amid demand and execution coming back to normal, we expect Q4FY23E to see a normalized topline performance. Order tendering momentum is expected to be strong and lumpy in FY23E as bunched-up orders in key sectors like power T&D, green energy corridor, railways, MRTS, renewables, water, infrastructure, etc, likely to be awarded.
On the working capital front, though capital goods companies have fairly managed their working capital situation despite challenges, they may still be focused on normalizing working capital and customer collections to improve the cash flow situation. Overall, companies with a strong balance sheet, asset-light business model, tight control on working capital, and strong cash balance are likely to gain as the economy gradually moves towards normalcy.
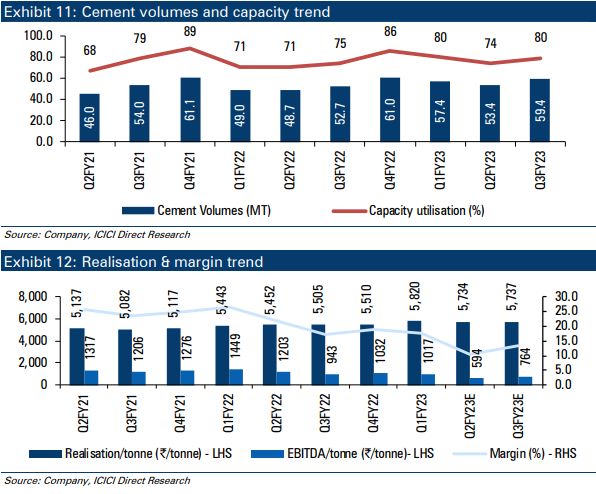
Cement Sector
- Cement players in Q3FY23 started witnessing an improvement in the margin curve (sequentially) as power, and fuel prices took a breather post the sharp rise during the Russian-Ukraine crisis in H1FY23.
- The pricing environment remained steady as realizations were flattish QoQ to Rs 5737/t (up 4% YoY). With healthy volumes, coupled with the declining cost of production (down 3% QoQ), EBITDA/ton improved 29% QoQ to Rs 764/t (but still down 19% YoY).
- On account of healthy underlying demand, cement players witnessed strong volume offtake. Capacity utilization improved 460 bps YoY to 80%+. Volumes grew 13% YoY to 59.4 MT.
- On the cost front, pet coke prices on a per Kcal basis declined 20% QoQ to Rs 2.3/Kcal. International coal prices had also softened by ~ 26% QoQ to $235/ton during Q3FY23.
Our View: Underlying cement demand is expected to remain healthy in the medium term (8-9% growth) owing to a boost in government spending on infra projects and upcoming general elections in 2024. Fuel prices have further softened with international coal prices declining 31% to US$140/t (flattish YoY).
Hence, overall, we expect a cost reduction of Rs 200-250/ton over the next two quarters. Also, companies are expected to undertake a price hike to the tune of Rs 10-15/ bag from mid-February onwards. Hence, we expect EBITDA/t to surpass Rs 1,000 levels from Q4FY23 onwards.
Chemicals
- The bright spots in Q3FY23 numbers of the I-direct Chemicals universe were Fluorochemicals (SRF, Navin), other specialty chemicals (Vinati, Neogen), agro chem CSM (PI Industries, Sumitomo) besides Tata Chemicals, which continued to ride on tighter global soda ash demand economics.
- On the flip side, subdued demand from end-user industries like dyes, pigments, paints, textiles, etc, impacted topline growth for some companies, while a delayed monsoon and higher inventory with customers impacted domestic agrochemicals players.
- Overall, the universe reported a decent set of numbers, with revenues growing 15% YoY to Rs 12,418 crore while EBITDA and PAT jumped 22% YoY & 14% YoY to Rs 2,747.6 crore and Rs 1,573.4 crore, respectively.
- On the margins front, EBITDA margins increased 137 bps YoY to ~22% for the I-direct universe (select pack) against expectations of ~22%.
- The deviation was not significant as most cost headwinds were addressed by a better product mix with a higher proportion of CRAMs execution and value-added products.
Consumer Discretionary
- The I-direct Consumer discretionary (CD) universe witnessed demand headwinds in Q3FY23 amid high inflation, inventory de-stocking, and the unfavourable base of last year.
- The leading paint and adhesive companies witnessed muted revenue growth (in the range of 1-7% YoY) supported by higher realizations, whereas volumes offtake was flat YoY. The muted volume offtake was attributable to the high base of last year and the extended monsoon in some regions.
- On the FMEG (Fast Moving Electric Goods) front, coverage companies witnessed weak rural demand amid high inflations and slow inventory build-up of winter-related home appliances.
- On the cost front, key raw materials like PVC, TiO2, and VAM prices have corrected at 12-20% from the Q2FY23 level. As a result, the EBITDA margin of coverage companies witnessed a recovery to the tune of 120 bps QoQ. However, on a YoY basis, the EBITDA margin was down ~215 bps YoY due to low operating leverage and restoration of advertisement expenses.
- V-Guard, Bajaj Electricals, and Crompton Greaves Consumer reported a muted revenue growth ranging from 1-7% YoY, respectively. However, Havells’ revenue growth at ~13% was higher than its peers mainly due to strong growth in its Lloyd and wire & cable business.
Our View: Going forward, we believe the EBITDA margin will see further recovery from Q4 onwards supported by improved operating leverage and easing inflationary pressure on RM prices.
FMCG
- The FMCG industry continues to see sales growth led by pricing intervention in the last one year. The FMCG market volume growth was negative for a third consecutive quarter. However, the intensity of decline was less in Q3 compared to H1FY23.
- The volume decline trend was much more prominent (to the extent of ~7%) in rural regions, whereas urban volumes were down ~2%. FMCG companies have taken steep price hikes in the last one year (10-15%) mainly due to unprecedented raw material price inflation.
- Though selective price cuts have started after correction in palm oil & crude-based raw material, sticky inflation in most other commodities has been preventing companies to take large price cuts. However, categories like cigarettes, detergent & carbonated drinks bucked the trend and witnessed high volume growth in Q3 (similar to H1FY23). These categories were severally impacted in the last two years due to a lack of mobility during the pandemic.
- One of the important vectors for the future growth of FMCG companies is innovation and foray into newer categories. In an inflationary scenario, investment in new launches has come down with limited resources. Companies have resorted to cutting down ad spending to protect operating margins.
- Despite a sharp decline in palm oil & crude prices, most other commodities have remained at an elevated level.
- Gross margins for HUL, Zydus Wellness, Tata Consumer, Dabur, Colgate, and Nestle India contracted by 200-500 bps YoY.
Our View: We believe rural demand conditions still remain muted considering the inability of FMCG companies to take large price cuts or restoration of grammage. Though commodities prices are slowly coming down, these still remain high compared to historic averages.
We believe a sharp correction in commodity prices is warranted to bring back volume growth to a high single digit. Most companies are shifting gears by focusing much more on high-growth categories like packaged foods, beverages, and health foods to compensate for the saturated growth in highly penetrated categories like soaps, hair oils, and oral care.
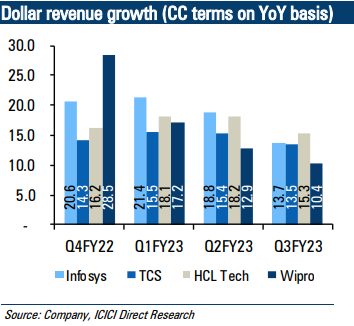
Information technology
- The growth momentum of IT companies was impacted in Q3FY23 by higher-than-expected furloughs, part reversal of the same is expected in Q4.
- In Q3, the macro-related impact on growth was visible across a few pockets in BFSI, retail, technology, etc, as well as some geographies like the US. The macro-related impact is likely to stay for the next few quarters, growth for IT companies is expected to be normalized compared to the high growth visible in the last two years.
- The deal pipeline continues to be healthy due to the continuance of critical cloud transformation programs (which are multiyear) as well as incremental opportunity in terms of cost take-out deals, conversion of the pipeline to TCV has not seen any material stress so far.
- Another trend, which was echoed by major players has been cost optimization deals taking the majority share in new deals on account of the high inflationary environment across major geographies.
- CC revenue growth for the quarter was muted, while currency tailwind helped strong dollar revenue growth. Continued rupee depreciation vs. the US dollar helped in further strong rupee growth for the quarter.
- The net hiring of most IT companies either remained muted or declined during the quarter as the companies focused on improving utilization after strong hirings in the last few quarters.
- The top IT companies (Tier 1) reported an average revenue growth of 13.2% YoY in constant currency (CC) terms. The growth was lower in both QoQ and YoY as the industry witnessed higher furloughs this quarter. In Q2FY23 and Q3FY22, the growth was 16.3% and 20.2%, respectively.
- The growth report by Tier 2 IT companies was 12.1% YoY in CC compared to 15.4% in the last quarter.
- All IT companies except LTIMindtree either improved or maintained the margins due to the easing of supply-side pressure, utilization improvement, pyramid optimization, and some moderation in attrition.
Infrastructure
- Overall revenue for roads and construction coverage universe witnessed decent growth, rising 13% YoY (to Rs 9,297 crore). The performance was a mixed bag as road operators had a muted quarter.
- Going forward, most EPC players are guided for healthy topline growth to be driven by the receipt of appointed dates in most of its projects and the expectation of strong inflows in the next few months.
- Margins in most companies are likely to move northwards with softening in input prices and better operating efficiencies.
- Construction activities during 9MFY23 were affected largely by an elevated level of input prices, and labor shortages along with heavy and prolonged monsoon periods.
Real Estate
- The real estate industry witnessed a steady performance in the residential sales momentum.
- Management commentary suggests the industry has not witnessed any major impact of the recent interest rate hike on housing demand. The rental portfolio remained steady on the office front, while the hospitality segment benefitted from strong ARRs (Accounting Rate of Return) and healthy occupancy.
Logistics
Although Q3 represents a festive-led season, on an overall basis, logistics companies saw subdued movement (single-digit topline growth), leading to a contraction in margins for TCI Express, and BlueDart on a YoY basis.
Media
- The media sector saw a mixed performance across segments. Multiplexes saw a strong recovery led by the performance of Avatar 2, Drishyam 2, and regional content like Kantara and PS-1. Broadcasters had a weak ad performance, with FMCG companies cutting ad spending and sports heavy quarter diverting ad spending from other segments.
- For multiplexes, footfalls were up ~22-32% QoQ and average ticket price (ATP) was also up ~6-9% QoQ owing to content performance and movie slate mix. The ad recovery was also muted (currently at 60-65% of pre-pandemic – similar to last quarter).
Metals & Mining
- For metal companies, Q3FY23 was marred by muted realizations. However, over the last few months, there was an uptick in prices, which would aid metal companies to report an improved performance during Q4FY23.
- On the global front, over the last three months, Chinese steel prices have seen an uptick of ~16% and are currently hovering at ~US$660/tonne.
- Seasonally, Q4 is traditionally the strongest in terms of sales volumes for domestic steel companies. An uptick in prices, during this period, augurs well for domestic steel players.
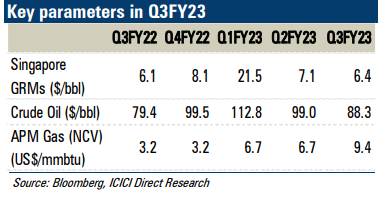
Oil & Gas
- Oil & gas companies reported a mixed set of numbers in Q3FY23. All three OMCs turned profitable during the quarter as marketing losses seemed to have narrowed down with the decline in crude prices.
- On the OMCs front, BPCL, and HPCL’s crude throughput increased ~7%, and 8% QoQ, respectively, whereas IOC’s crude throughput improved by 15% QoQ as it restarted its Paradip refinery after a planned maintenance shutdown.
Pharmaceuticals
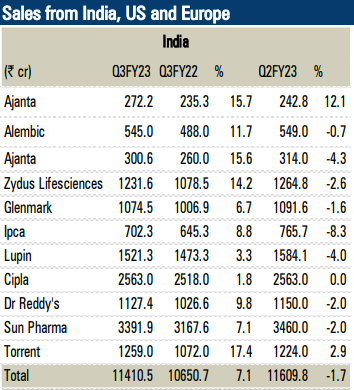
- I-Direct Pharmaceutical universe (13 coverage stocks) revenues grew 12.7% YoY to Rs 51,644 crore, driven mainly by complex launches in the US by large players, India formulations, and APIs.
- Indian formulations (select pack) revenues grew 7.1% YoY to Rs 11,411 crore, and the below-estimate growth print was due to the Covid component in the base business. Adjusting for Covid impact, growth was driven by new launches and traction across chronic therapy areas like cardiac, respiratory, and acute segments such as anti-infectives.
- US business (select pack) expanded 23.1% YoY to Rs 13,640 crore.
- Oral solids (OSDs) continued to face significant price erosion, ranging between mid-single digit and low-teens.
- Generic API players witnessed price erosion but growth was mainly driven by volumes in select APIs. API segment (select pack) overall sales grew 11.6% YoY to Rs 4833 crore.
- Europe sales grew 2% YoY to Rs 2892 crore, overcoming the currency headwinds (rupee appreciation) mainly due to new launches.
- EBITDA margins declined 20 bps YoY to 22.5% for I-direct universe (select pack) due to a YoY increase in pricing erosion in the US and a rise in input, logistic and power costs.
Retail
- Retail players witnessed healthy revenue growth momentum in October 2022, driven by the festive season. However, the momentum waned post the festive season.
- Companies witnessed a deceleration in revenue growth in November and December. Some companies resorted to preponing the end-of-season sales (EoSS) to boost revenues.
- The industry witnessed heightened competitive activity with increased discounting in certain categories like innerwear and kitchen appliances.
- Mass-category product sales were negatively impacted due to higher price points owing to price increases taken by companies in earlier quarters and higher inflation, which impacted the purchasing power of mass-category consumers.
- To boost revenue growth some companies have made price corrections in Q3FY23 with an easing of raw material costs.
Key notable surprises and stock calls
Below are some stocks where the results are POSITIVE and we have a BUY rating.
Source: ICICIdirect Research
Disclaimer: Disclaimer: ICICI Securities Ltd. (I-Sec). Registered office of I-Sec is at ICICI Securities Ltd. - ICICI Venture House, Appasaheb Marathe Marg, Prabhadevi, Mumbai - 400 025, India, Tel No : 022 - 6807 7100. I-Sec is a Member of National Stock Exchange of India Ltd (Member Code :07730), BSE Ltd (Member Code :103) and Member of Multi Commodity Exchange of India Ltd. (Member Code: 56250) and having SEBI registration no. INZ000183631. I-Sec is a SEBI registered with SEBI as a Research Analyst vide registration no. INH000000990. Name of the Compliance officer (broking): Ms. Mamta Shetty, Contact number: 022-40701022, E-mail address: complianceofficer@icicisecurities.com. Investments in securities markets are subject to market risks, read all the related documents carefully before investing. The contents herein above shall not be considered as an invitation or persuasion to trade or invest. I-Sec and affiliates accept no liabilities for any loss or damage of any kind arising out of any actions taken in reliance thereon. Such representations are not indicative of future results. The non-broking products / services like Research, etc. are not exchange traded products / services and all disputes with respect to such activities would not have access to Exchange investor redressal or Arbitration mechanism. The contents herein above are solely for informational purpose and may not be used or considered as an offer document or solicitation of offer to buy or sell or subscribe for securities or other financial instruments or any other product. Investors should consult their financial advisers whether the product is suitable for them before taking any decision. The contents herein mentioned are solely for informational and educational purpose.