


Download
iLearn application
Elevate Your Financial Knowledge with the
ICICI Direct iLearn App


People often say that markets perform in cycles. A cursory look at the Nifty 50 price graph indicates that there have been upward, downward, and sideways trends. In financial parlance, these trends are referred to as bull cycles, bear cycles, and consolidating cycles, respectively.
The graph below highlights the price returns of the Nifty 50 index between January 2005 and September 2022. Based on the price trend, the graph below is divided into smaller periods of bull, bear, and consolidation cycles.
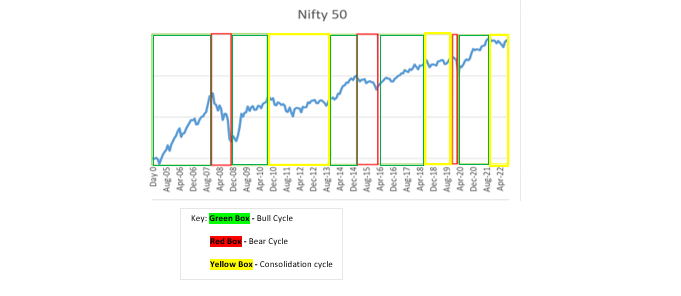
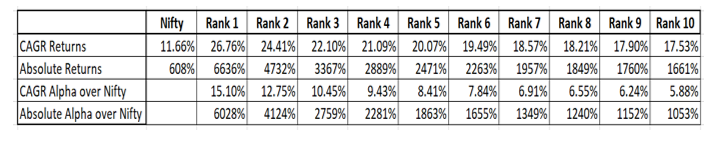
The table below captures the returns and time-lines for which the cycles have lasted:
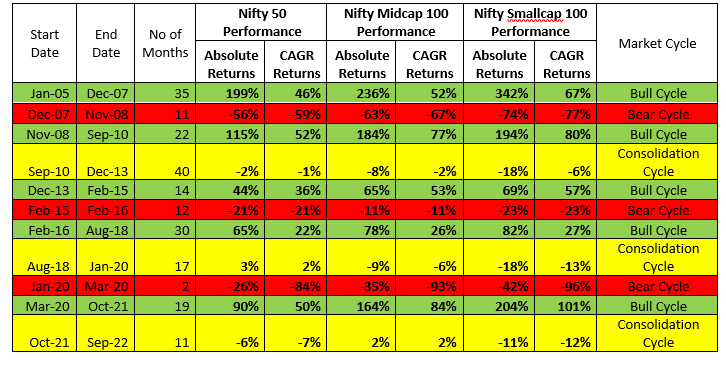
A key takeaway from the chart is that bull and consolidation cycles last for longer durations as compared to bear cycles. Another point to note is that historically, a bear cycle was followed by a bull cycle.
In bull cycles, midcap and smallcap indices outperform the largecap index. Conversely, in bear cycles and consolidating cycles, small and midcap underperform as compared to largecap . Hence, one should position their allocation to market caps accordingly.
Cyclicality Of Mutual Fund Performance
Investment strategies must function in cycles as well, since markets produce returns in cycles. We selected open ended equity diversified market capitalization funds from 38 mutual fund AMCs (market cap funds include large cap funds, large & midcap funds, mid cap funds, small cap funds, flexi cap funds, multi cap funds, and focused funds) in order to test the performance of investment strategies across cycles. We assumed that the main tenets of investment philosophy remain constant when choosing stocks across any market capitalization.
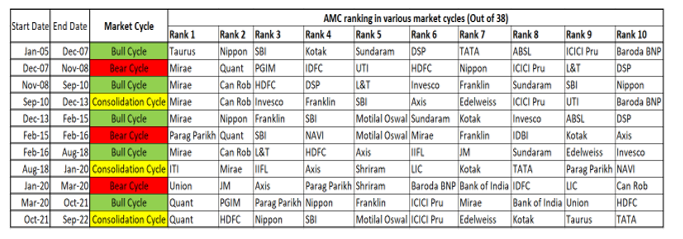
The next step involved ranking the performance of AMCs across these market cycles to observe which had the most suitable investment philosophy to invest in during a market cycle. To do so, we ranked AMCs’ based on the average performance of all market cap schemes in a cycle.
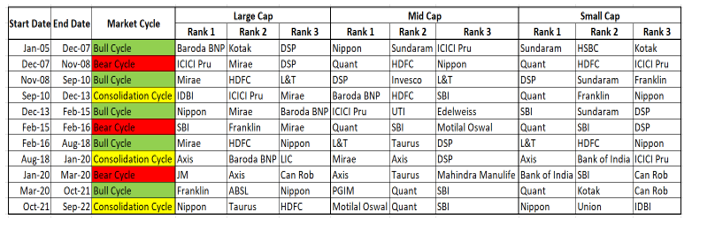
Table below highlights the rankings of AMCs across different cycles:
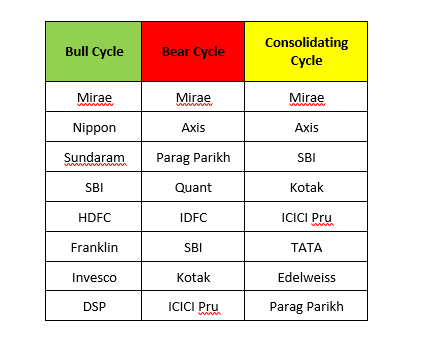
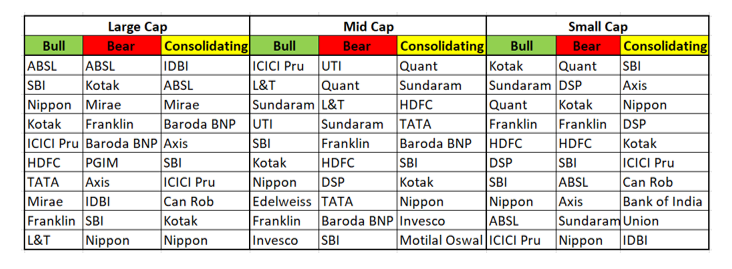
AMCs which have the highest frequency of performing in the bull, bear and consolidating cycles have been highlighted in the table below:
A notable conclusion of this experiment is that if an investor had been able to correctly foresee these cycles, they may have produced higher alphas over the Nifty 50. One would have earned absolute returns of 6636%, or 26.76% CAGR returns, if they were able to forecast every rank 1 AMC. They would have produced a 6028% absolute alpha over Nifty, or a 15.1% CAGR alpha over Nifty. A person would have made 4124% absolute alpha over Nifty, or 12.75% CAGR alpha over Nifty, if they had predicted all rank 2 AMCs.
Cyclicality Of Market Cap Performance
A further deep dive into each category indicates that AMCs have differing competencies in managing money across market caps too:
AMCs which have the highest frequency of performing in Bull, bear and consolidating cycles as per market cap have been highlighted in the table below:
Conclusion
At ICICI Securities, we conduct a more granular study to identify the performance of AMCs in cycles and arrive at the most consistent performer in bull, bear, and consolidation cycles. This increases the probability of predicting the right AMC which can potentially do well in a particular cycle and therefore enhance returns.
Learn about DP ID in a demat account, how it differs from a Client ID, NSDL and CDSL formats, where to find it, and why it matters for investors.
Discover the right demat account for your investing needs by checking costs, platform quality, product access, safety features and support services.
Learn how to read a demat holding statement, check securities, DP ID, client ID, BO ID, valuation and download statements from NSDL, CDSL or CAS.


Elevate Your Financial Knowledge with the
ICICI Direct iLearn App
Elevate Your Financial Knowledge with the
ICICI Direct iLearn App
