


Download
iLearn application
Elevate Your Financial Knowledge with the
ICICI Direct iLearn App


10th March is going to be the most important day for year 2022 due to the results being announced on the State Assembly Election which is going to be held in 5 states starting from 10th February. The detailed schedule of polls for each state is given in the table below.
|
Polling |
State |
Current Government |
Results Expected |
|
10, 14, 20, 23, 27 February, |
UP |
BJP |
10th March 2022 |
|
14-Feb-22 |
Uttrakhand |
BJP |
10th March 2022 |
|
14-Feb-22 |
Goa |
BJP |
10th March 2022 |
|
20-Feb-22 |
Punjab |
Congress |
10th March 2022 |
|
27th Feb and 3rd March 2022 |
Manipur |
BJP,NPP,NPF |
10th March 2022 |
Of the 5 states, UP is considered to be crucial for the government in centre because the politics in UP is going to set the base for General Election 2024 due to its enormous 403 number of seats. The BJP led government in UP and other states is facing lot of pressure from the opposition and therefore the stock market is expected to witness a huge volatility run up to the results of the state assembly elections.
We have gathered NIFTY and BANKNIFTY market movement information on the state elections held in last 5 years. Volatility data of both the Indices on the day of result and up to 40 days before the result announcement was collected. Indices movement against each election is tabulated. A comparison graph showing zig-zag lines for each date is also shown to give you a perspective of the volatility run up to election result.
|
Past State Elections Year |
Result Date |
States |
Nifty move on Result Day (%) |
Up to 40 days before Result Announcement. % Range |
BankNifty move on Result Day (%) |
Up to 40 days before Result Announcement. % Range |
|
2021 |
02-May-21 |
Assam, Puducherry, WB, Tamil Nadu, Kerala |
1.78% |
6.23% |
2.07% |
12.71% |
|
2020 |
10-Nov-20 |
Bihar |
1.35% |
9.58% |
3.17% |
40.94% |
|
2020 |
11-Feb-20 |
Delhi |
0.60% |
7.03% |
0.90% |
10.07% |
|
2019 |
24-Oct-19 |
Maharashtra |
1.26% |
9.78% |
2.41% |
15.80% |
|
2018 |
11-Dec-18 |
Rajasthan, Telangana, MP, Chhattisgarh, Mizoram |
2.26% |
9.76% |
2.46% |
10.94% |
|
2017 |
11-Mar-17 |
UP |
0.69% |
6.78% |
1.02% |
9.27% |
|
Average |
|
|
1.32% |
8.19% |
2.00% |
16.62% |
From the table, you can observe that on the day of the result, Nifty Index has moved 1.32% while Bank Nifty Index has moved around 2% on an average for the state elections held in last 5 years. Surprisingly, the large movement in the indices has been observed during 40 days’ period before the date of election results. Nifty Index has moved 8.19% while Bank Nifty has shown a significant move of 16.62% on an average. As mentioned earlier result of U.P is important and thus below table will give you a perspective on how markets have reacted during its last 4 elections held.
Additional Read: Union Budget 2022
|
Past State Elections |
Result Date |
State |
Winner |
Nifty On the Day (%) |
40 days NIFTY Volatility Range (%) |
|
2017 |
11-Mar-17 |
UP |
BJP |
0.69% |
6.78% |
|
2012 |
06-Mar-12 |
UP |
Samajwadi Party |
3.37% |
11.52% |
|
2007 |
11-May-07 |
UP |
Bahujan Samaj Party |
2.84% |
16.49% |
|
2002 |
03-May-02 |
UP |
BSP-BJP |
0.64% |
7.36% |
|
Avg - 1.89% |
Avg - 10.54% |
Nifty movement on the day of result was observed around 1.89% on an average while 10.54% was observed during 40 days’ period before the date of election results.
Veteran Derivatives trader would like to take advantage of such market volatility ahead of election by deploying their favourite option strategies like Calendar Spread, Long Straddle, Bull Call spread and Call Ratio Back Spread to make the most of the event. Each strategy is explained in detail below.
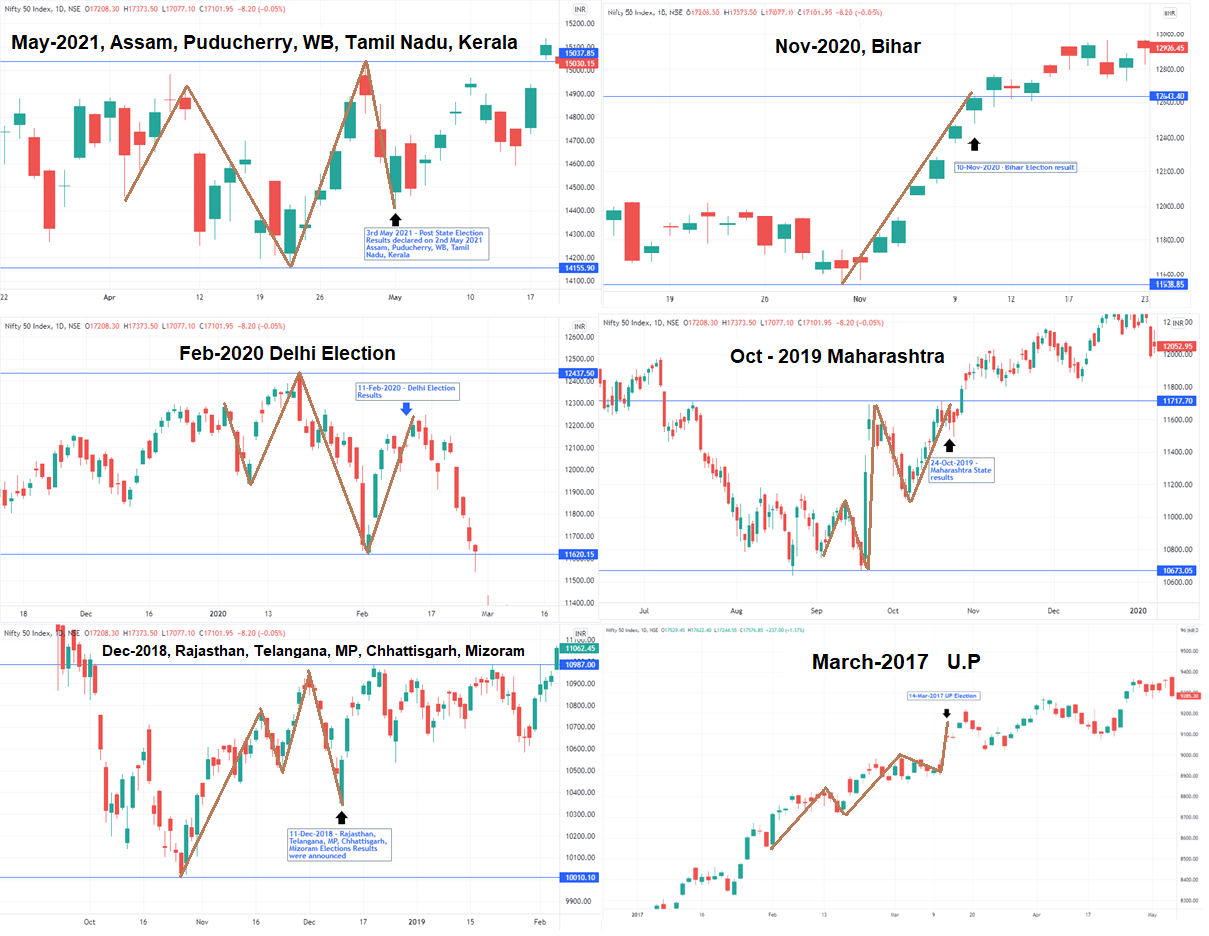
Figure 1: NIFTY Chart during each election
Calendar spread is the limited risk and limited profit strategy where one buys a far month option and sells near month option to recover some cost of the trade.
Traders having bullish view of the market can deploy long calendar spread strategy before polling begins on 10th Feb 2022. Here you will need to Buy 3rd March Nifty Expiry 18000 Call at a price of around 182 having an Implied Volatility of around 16.5 and Sell 24th February month end expiry 18000 Call at a price of 148 having an implied volatility of around 19.75 to reduce the cost and margin of the strategy. You can view margin required is merely around 31400 as opposed to 85500 in ICICIdirect basket order. (Price and volatility may vary for you depending on the day and time you take the position).
The maximum loss is the cost of the premium paid (182-148 = 34) i.e. 34*50 = Rs.1700. The maximum profit will be observed on the expiration day of the near month Call if the market closes around 18000 strike. The profit is calculated as the time value remaining with the farther month Bought option minus the value of the Sold option at expiration.
Conceptually, this strategy has two breakeven points and ideally these points are the stock price at the expiration of the short call. Identifying the exact level of breakeven points is difficult because the value of long call depends on the volatility of the option which is one of the greek factor in the option prices. A typical pay-off chart for Long calendar option is shown in figure 4.
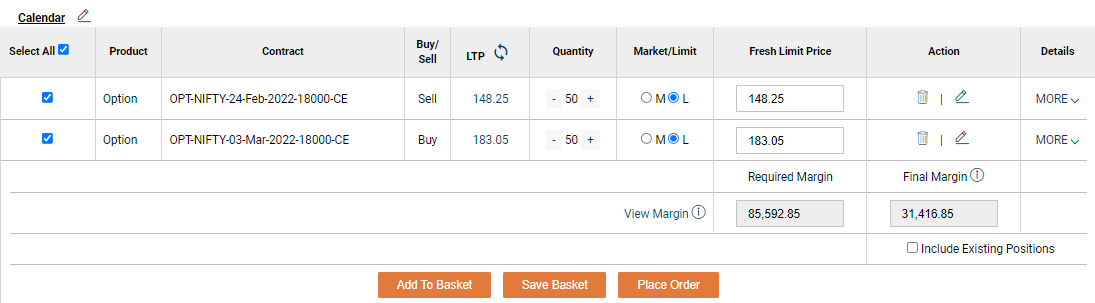
Figure 2: Long Calendar Strategy
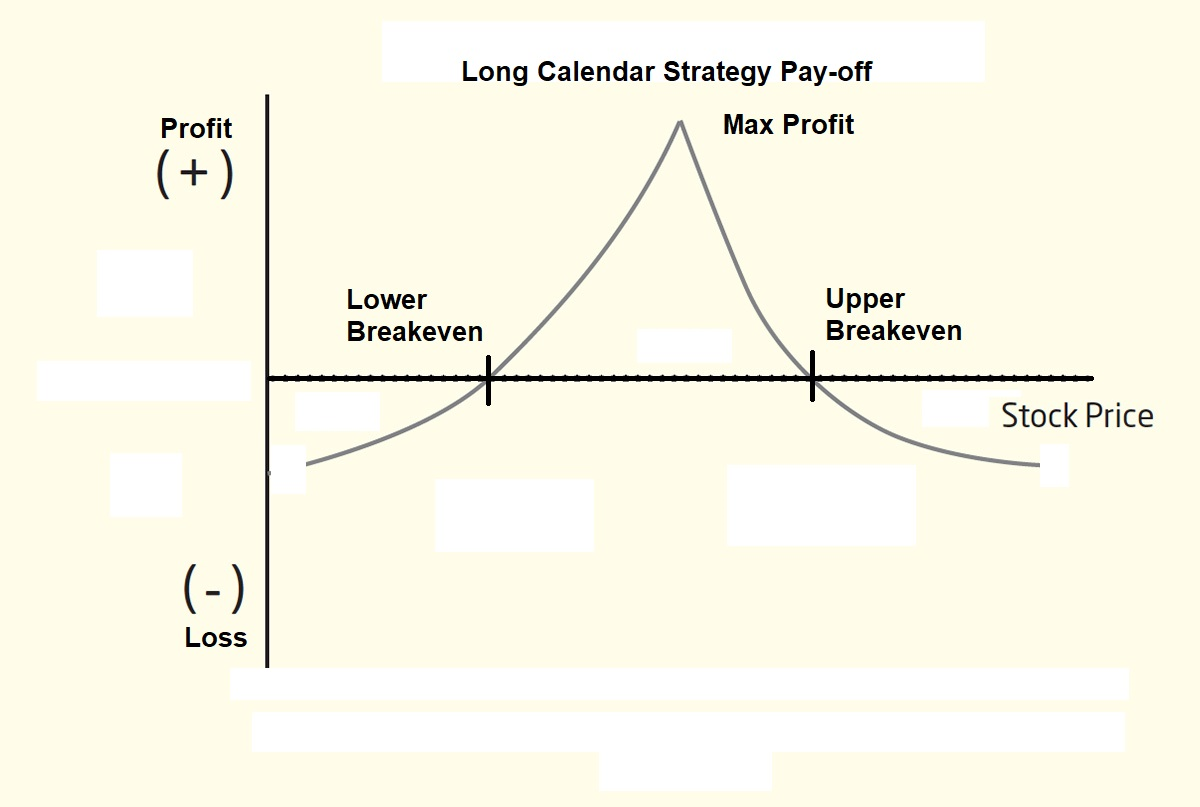
Figure 3: Typical Long Calendar Payoff Chart
Traders who understands implied volatility may choose to go for such setup because of two reasons:
a) Buying lower volatility for farther month Call (16.5) and shorting higher volatility of the present month Call (19.75).
b) The likelihood of the farther month call retaining most of its premium value is high because of the number of day remaining for expiration. As the number of days reduces while approaching the election result, implied volatility tends to increase because of the upcoming event. Thus the premium of the call with 3rd March is expected to gain in value due to implied volatility.
Traders having bearish view of the market can deploy same strategy on the Put side of the Nifty to benefit from the fall in market.
In long strangle strategy, trader buys OTM Call and Put Option by paying a premium. This strategy is deployed when a trader is expecting a large move in the market but unsure about the direction of the move. This is a net debit strategy. The potential upside is unlimited as per pay-off chart below and you will have two breakeven points.
Upper Breakeven = CALL Strike + Premium paid for CALL
Lower Breakeven = PUT Strike + Premium paid for PUT
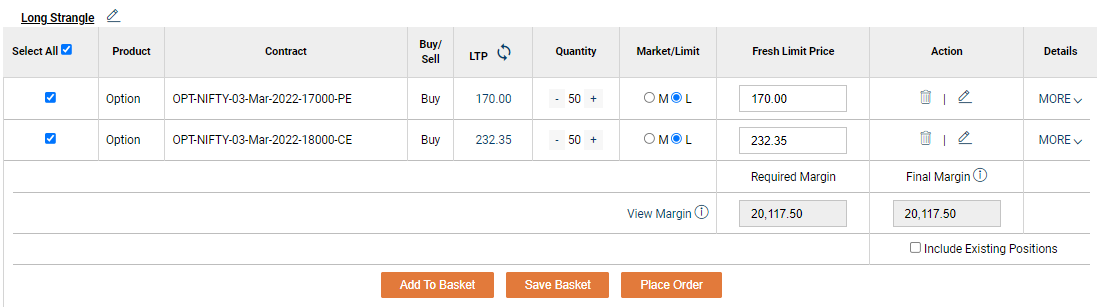
Figure 4: Long Strangle Strategy
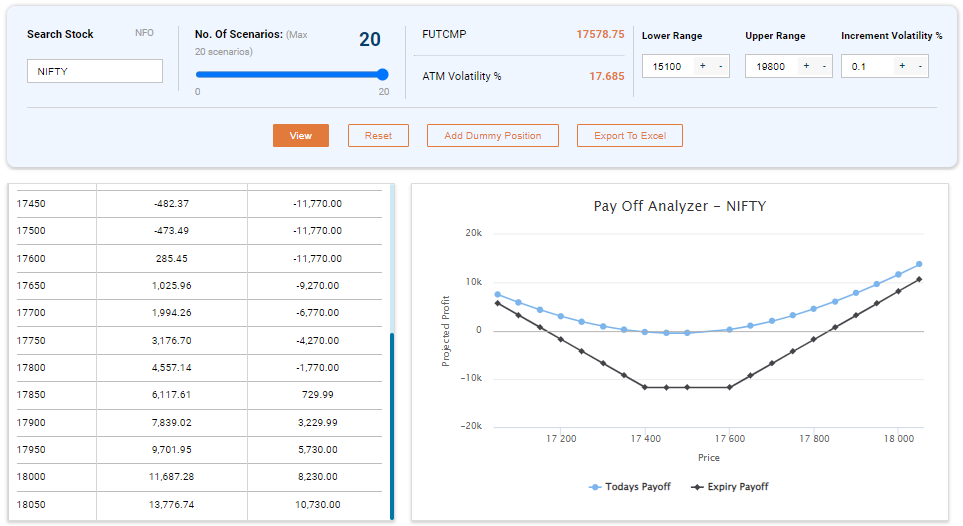
Figure 5: Typical Long Strangle Pay-off Chart
The maximum loss is between the two strikes limited to the premium of both CALL and PUT premium paid. This could be possible if the market doesn’t show significant movement on either side. The margin required is the premium paid due to both legs being long. In below example, you can buy 3rd March 17000 PUT and 18000 CALL. The total premium paid is ₹20117.5. This is a low risk and high probability strategy especially when traders expect an event in short period and would like to take the advantage ahead of the event.
Bull Call spread is the most popular strategy when a trader would like to make a directional bet and is having bullish view of the market. This strategy is having two legs of option. You will need to BUY At-the-Money or Near the Money Call and simultaneously SELL Out-the-Money Call in equal quantity of the contracts with same expiration date to recover some cost of the premium paid. This strategy is also called a debit spread because of the net premium paid due to the higher premium value of the Buy Call option.
In example below, the current Nifty Price is around 17600. Based on historical data, the movement of Nifty Index is expected to be of more than 10% run up to election results, thus due to high liquidity available you can implement this strategy in Feb month end expiry contracts. You can buy 18000 Call at a premium of 110 and Sell 18200 Call at a premium of 65. Thus net debit of 45*50= ₹2250. The margin required for this strategy is only ₹23000 as opposed to ₹79800 which can be viewed in ICICIdirect Basket order.
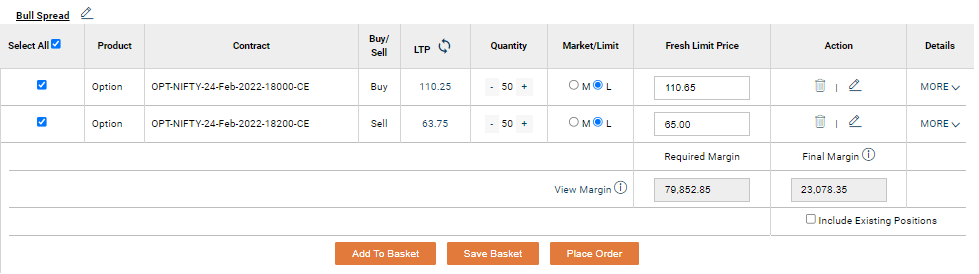
Figure 6: Bull Call Spread Strategy
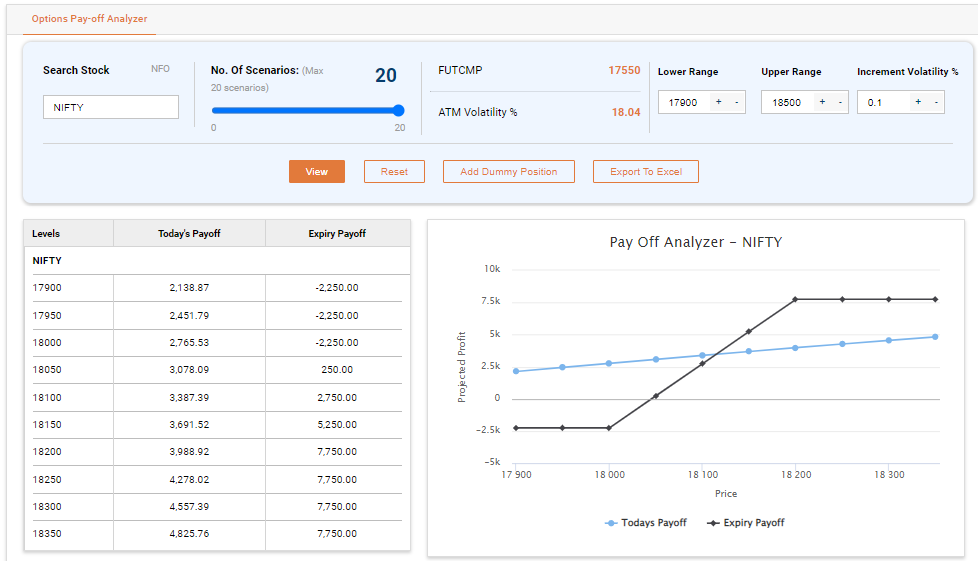
Figure 7: Bull Call Spread Pay-off Chart
From the ICICIdirect Options Pay-off Analyzer you can see that the maximum profit is the spread between the two strikes minus the premium paid. In this case max profit is around ₹7750 while the maximum loss is the premium paid which amounts to ₹2250. Thus you have a risk-reward ratio of 1:3 which is amazing for the option trader to make consistent profit.
Traders having bearish directional view can trade the same on the Put side to benefit from fall in the prices of the Index.
Additional Read: Smart tips for beginners in the Stock Market
This strategy is suitable for a trader who is expecting a rise in volatility over the period and would like to take the advantage by taking directional bet. This is limited loss and unlimited profit strategy where you SELL 1xATM or ITM Call and buy 2xOTM Call to limit the losses in case the direction goes wrong. In the example below you can SELL 1x 18000 Call at a premium of ₹105 and BUY 2x 18100 Call at ₹80. This strategy now has a net debit (cash outflow) of ₹55 however, if a trader chose to go more OTM for the send leg, then there is a probability to find an opportunity to have a breakeven or net credit strategy. The Margin required is only ₹26000 as opposed to ₹89700 as shown in ICICIdirect basket order.
Profit on the upper-side is unlimited while maximum loss is when the underlying stock price equals the strike price of Long Call at expiration plus the premium paid. This is when both Long calls expire worthless and the short call retains the ITM value.
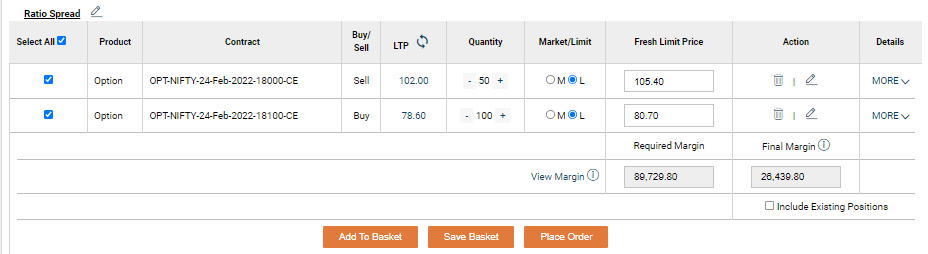
Figure 8: Call Ratio Backspread Strategy
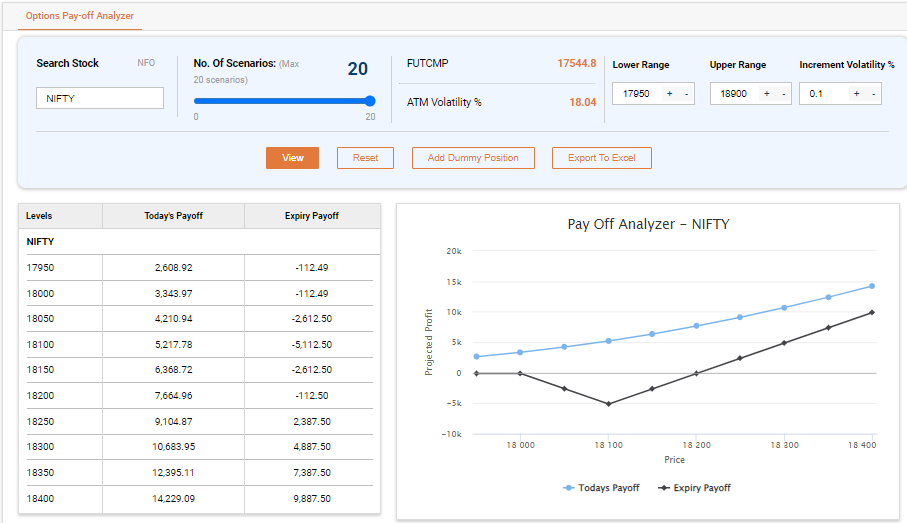
Figure 9: : Call Ratio Backspread Strategy Pay-off
The strategy can also be deployed in case the trader wants to take a directional bet with bearish view by Selling 1x ATM or ITM Put Option and buying 2x OTM Put option.
Gold can react to inflation data, while crude oil may jump after an inventory report or geopolitical disruption.
Understand how crude oil trading works on MCX and also learn about contract sizes, expiry, trading hours, global benchmarks, price drivers and risks before you trade.
Learn how to calculate the break-even point in commodity trading by factoring in brokerage, taxes, and other charges


Elevate Your Financial Knowledge with the
ICICI Direct iLearn App
Elevate Your Financial Knowledge with the
ICICI Direct iLearn App
