
Download
iLearn application
Elevate Your Financial Knowledge with the
ICICI Direct iLearn App


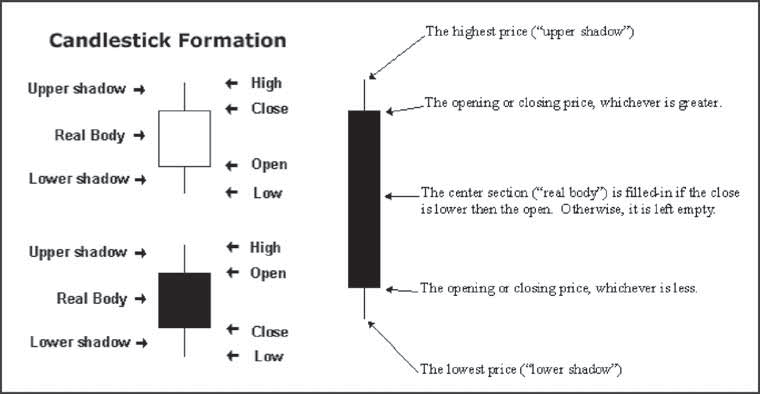
Candlesticks are a way of communicating information about how price is moving. As the name suggests, the candlesticks charts resemble a simple candlestick with a body and wick.
To understand the need and power of candlestick charts, let’s analyse the price action movement of TCS over the last month:
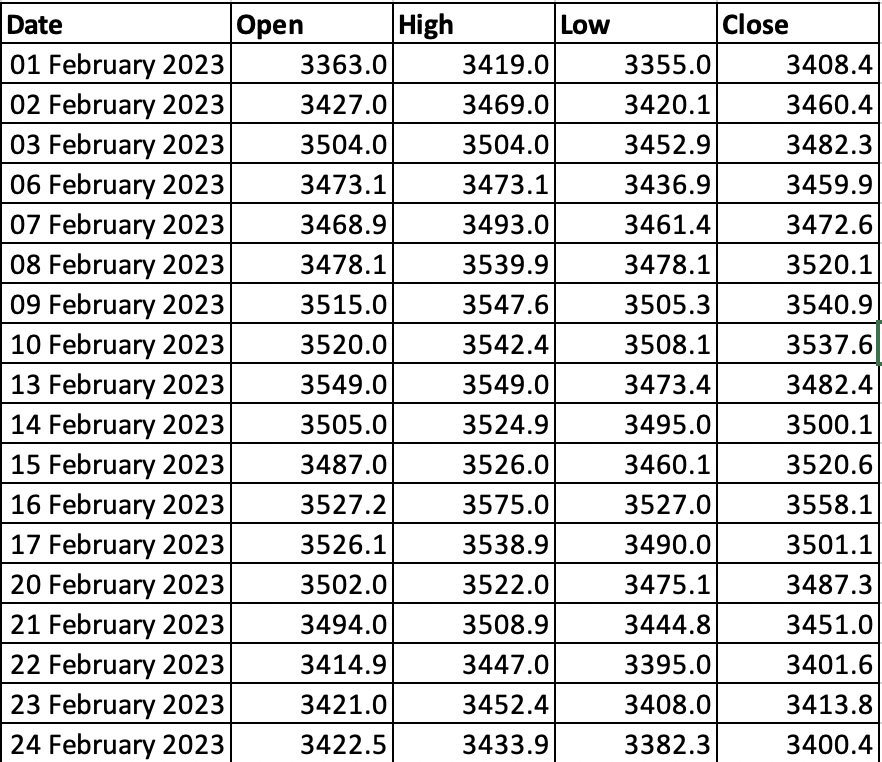
The table above contains the daily reported price movement of TCS from 1st Feb 2023 to 24th Feb 2023.
You have 2 minutes to come to a conclusion by just looking at the above table. What is your analysis? Could you understand the price movement, or could you observe any pattern?
If you are not a maths genius, I would say it would have been very difficult for you to draw any conclusion from all these numbers.
Let’s give it another go, but this time we’ll use the figure below:
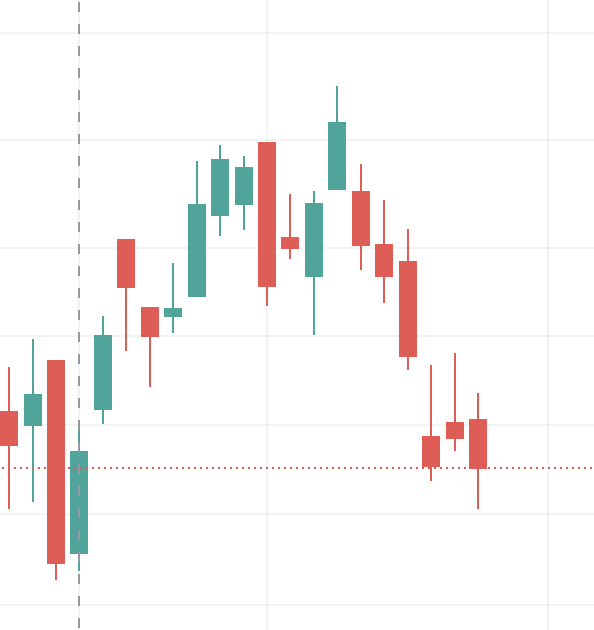
The table and the chart both are representing the same information: Daily Price movement of TCS in Feb’23, but notice how much easier it is to process information when it is in the form of a chart or picture rather than old boring numbers in a table.
Just a look at the chart, you can easily figure out the road map of where the prices have been and get a sense of the trend the prices have been following in the last 1 month.
Let us look at some of the candlestick patterns and their significance:
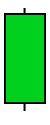
Candlesticks with a long upper wick, long lower wick, and small real body are called spinning tops and typically represents indecision in the market.
Market view
The small body (whether red or green) of the candle indicates little movement from open to close, and the wicks indicate that both bulls and bears were active during the session. Despite the fact that the trading session opened and closed with little change, prices moved considerably higher and lower in the meantime. As a result, there was a standoff because neither buyers nor sellers could gain the upper hand. A spinning top after a long green candlestick denotes the bulls' weakness and hints at a potential trend change or interruption. Similarly, a spinning top after a long red candlestick denotes the bears' weakness and hints at a potential trend change or interruption.
Criteria
Trade setup
Market view
Criteria
Trade setup
To read about candlesticks and technical analysis in detail, click here
Since the spinning top indicates indecision, it is crucial to wait for a confirmation signal before buying. Set a stop loss and check for potential trend reversal. If the price is within a range, trade by buying at support and selling at resistance.
The spinning top candle indicates indecision and uncertainty about the course of an asset in the future. But it can also signify a potential trend reversal of the asset's price in the future.
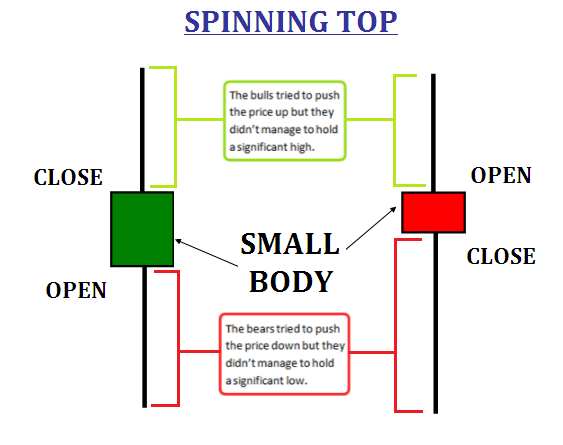
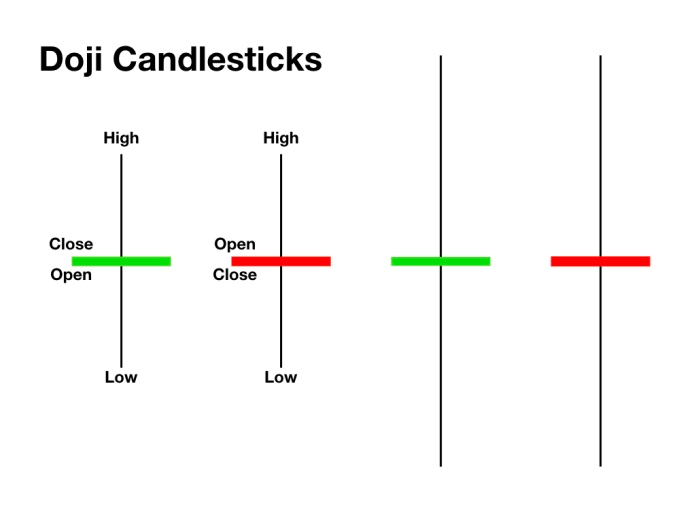
Even though both of these represent indecision, there is one key difference: their Bodies. A Doji has a small real body and small upper and lower shadows, while a spinning top has long upper and lower shadows.
Since Dojis normally represents an indecisive market, it is considered to be a neutral pattern that neither hints at an uptrend nor a downtrend.
Dojis are a neutral indicator, and they provide very little information. And since they are rare, they are not considered reliable for spotting reversals.
Understand silver trading, contract types, pricing factors, risks and expiry rules.
Additional Exposure Margin increases capital requirements for concentrated F&O securities.
Learn the essential F&O trading rules every beginner should understand before trading.


Elevate Your Financial Knowledge with the
ICICI Direct iLearn App
Elevate Your Financial Knowledge with the
ICICI Direct iLearn App
