loader2
Partner With Us NRI

Page Industries Ltd share Price Today

Company details

34,822.00
35,499.00
33,070.05
43,570.00
6M Return -8.35%
1Y Return -8.13%
Mkt Cap.(Cr) 39,475.57
Volume 16,410
Div Yield 0.71%
OI
-
OI Chg %
-
Volume 16,410

Open Free Trading Account Online with ICICIDIRECT

Incur '0' Brokerage upto ₹500
About The Stock

    Page Industries is the exclusive licensee of Jockey international brand and is the market leader in the premium innerwear and leisurewear category. The brand is distributed in 2,895+ cities & towns and available in 118838+ MBOs and 1191+ EBOs. It sold ~ 190 million pieces in FY22.

    • Strong backward integration facilities having capacity of 260 million pieces
    • Robust business model generating 66%+ RoCE, delivering consistent EBITDA margins of 20%+ and having debt free b/s
Q3FY23 Results:

    Page reported a subdued operational performance wherein revenues and profitability were below our estimates. Gross margin declined 86 bps YoY to 52.4% but EBITDA margin declined 532 bps YoY to 15.8% (significantly lower than normally guided band of 19-21%) owing to negative operating leverage.

    • Revenue for Q3FY23 grew 3% YoY to ₹ 1223 crore. Growth was mainly realisation led, which increased 15% YoY to ₹ 232/piece. Volume de-grew 11% YoY to 52.8 million pieces due to subdued demand in athleisure
    • Under-absorption of fixed overheads, accelerated spends towards marketing expenses impacted EBITDA margin. Hence, EBITDA declined 23% YoY to ₹ 193 crore. Ensuing PAT de-grew 29% YoY to ₹ 123.7 crore

Click here for full recommendation

Research view on more stocks

Apparels & Accessories company Page Industries announced Q3FY24 & 9MFY24 results:

Financial Highlights for Q3FY24:

  • Sales volumes witnessed a 4.6% YoY growth, reaching 55.2 million pieces.
  • Revenue reached Rs 12,288 million, showing a year-over-year increase of 2.4%.
  • EBITDA for the quarter amounted to Rs 2,352 million, marking a growth of 19.1% compared to the previous year, with healthy margins of 18.6%. The impact of investments in digital transformation and marketing initiatives was balanced by favorable input costs and operational expenses optimization.
  • Profit After Tax (PAT) was Rs 1,524 million, indicating a significant increase of 23.1% compared to the same period last year, with PAT margins at 12.3%.

Financial Highlights for 9MFY24:

  • Revenue totaled Rs 35,863 million, reflecting a 4.4% decline, attributed to the subdued performance in the early part of the fiscal year.
  • EBITDA recorded at Rs 7,051 million, with a slight 3.2% decline YoY.
  • PAT stood at Rs 4,610 million, down by 6.5% YoY.

Commenting on the results, V.S. Ganesh, Managing Director, Page Industries said, “I am pleased to share that the Company has successfully navigated the complexities of mixed demand trends in the retail sector, a landscape marked by a significant shift in consumer spending patterns. Our strategic commitment to sustainable sales practices and meticulous inventory management has been instrumental in robust margins and enhanced profitability. We have seen early signs of stabilizing revenue in Q3 on the back of our adaptive strategies in response to the market's evolving demands. Our concerted efforts to optimise operational efficiency, have been pivotal in enabling us to achieve an impressive 23.1% growth in PAT for Q3.

With continued investments in expanding the distribution network and enhanced e-commerce capabilities, we are geared to seize long-term growth opportunities. We are well-positioned to continue this trajectory of growth, leveraging operational efficiencies and strategic investments to deliver value to our stakeholders.”


Result PDF

View Other Company Results

Page Industries Ltd shares SWOT Analysis

Strengths (6)

  • Growth in Quarterly Net Profit with increasing Profit Margin (YoY)
  • Company with Low Debt
  • Annual Net Profits improving for last 2 years

Weakness (4)

  • Poor cash generated from core business - Declining Cash Flow from Operations for last 2 years
  • Degrowth in Revenue and Profit
  • Low Piotroski Score : Companies with weak financials

Opportunity (0)

Data not found

Threats (3)

  • Companies with growing costs YoY for long term projects
  • High PE (PE > 40)
  • Increasing Trend in Non-Core Income

Resistance and support

R1 35,652.9
R2 35,914.5
R3 36,329.9
Pivot

35,237.47

S1 34,975.9
S2 34,560.5
S3 34,298.9
EMA SMA
35,276.4
35,556.3
36,278.0
37,403.5
34,935.6
35,402.5
36,479.6
37,554.4
Delivery and volume
CLIENT NAME DEAL TYPE ACTION DATE AVG. PRICE QUANTITY EXCHANGE
KADENSA MASTER FUND Block Purchase 2024-01-24 36398 13340 BSE
BOFA SECURITIES EUROPE SA Block Sell 2024-01-24 36398 13340 BSE
ISHARES CORE MSCI EMERGING MARKETS ETF Block Purchase 2022-11-14 47560.9 9087 NSE
Name Category Shares
Ramesh Genomal PROMOTER 15.01%
Sunder Genomal PROMOTER 11.94%
Sanjeev Naraindas Genomal PROMOTER 5.13%
Sadhna Vijay Hirdaramani PROMOTER 3.62%
Simran Keshav Mahtani PROMOTER 3.62%
Dharmesh Naraindas Genomal PROMOTER 2.71%
Madhuri Genomal PROMOTER 1.23%
Shamir Genomal PROMOTER 0.62%
Pamela Kirpalani PROMOTER 0.61%
Rohan Genomal PROMOTER 0.61%

OUR RESEARCH VIEW

Investment recommendation
Call Date
10 Feb 2023
Entry Price 39,000.00
Target Price 37,550.00
Duration
12-18 Month

FINANCIALS

Sales
Operating Profit
Profit after Tax
Equity
Reserves and Surplus
Debt
Sales
Operating Profit
Profit after Tax
PE
Debt/Equity
P BV

Page Industries Ltd Stocks COMPARISON

Financials( in Cr) Page Industries Ltd K P R Mill Ltd Gokaldas Exports Ltd Kewal Kiran Clothing Ltd Dollar Industries Ltd
Price 35,391.40 844.05 809.40 695.50 542.75
% Change 0.10 1.39 0.20 -1.53 1.74
Mcap Cr 39,475.57 28,850.81 5,130.22 4,286.02 3,078.26
Revenue TTM Cr 4,788.64 6,208.06 2,222.20 779.45 1,393.83
Net Profit TTM Cr 571.25 814.10 172.97 119.02 52.45
PE TTM 73.09 36.00 38.35 28.96 53.43
1 Year Return -8.13 37.89 121.84 65.14 54.12
ROCE 53.56 26.10 21.20 27.84 9.10
ROE 46.45 22.66 19.58 23.22 7.61
INSIDER & INSTITUTIONAL ACTIVITY

Equity Capital: 1,371.04 Cr FV: 10.00

Period MF Net Purchase / (sold) FII Net
LAST 1M 24,289.49 -9,580.22
LAST 3M 82,644.28 34,986.47
LAST 6M 142,142.07 66,572.41
LAST 12M 216,755.16 194,314.28

Page Industries Ltd Information

Stock PE (TTM)
73.09
Promoter Holding
45.11%
Book Value
1372.1439
ROCE
53.56%
ROE
46.45%
Description
  • Page Industries is an Indian firm that manufactures and markets apparel such as innerwear, loungewear, and socks. The company has its headquarters in Bengaluru, Karnataka. It was founded in 1995 and has since expanded its operations to several countries, such as Sri Lanka, Nepal, Bhutan, United Arab Emirates, Qatar, Bangladesh, and others. The company is the exclusive licensee of Jockey, which is an internationally renowned brand in the apparel space.

    On 5 January 2023, the market capitalisation of Page Industries Limited was Rs 46,988.01 crores, and it reported consolidated sales of Rs 3,886 crore at the end of June 2022.

    The company is listed on the Bombay Stock Exchange with the code 532827 and the National Stock Exchange with the code PAGEIND. On 30 June 2022, the company’s shareholding pattern indicated a promoter stake of 461%, a 0% stake of foreign institutional investors, and a public stake of 35.04%. The company’s shareholding pattern has remained largely the same over the last year. 

    The company’s board of directors includes Sunder Genomal, V S Ganesh, Shamir Genomal, Rohan Genomal, Mark Fedyk, Nari Genomal, Ramesh Genomal, and Arif Vazirally. S R Batliboi & Associates LLP are the company’s auditors. On 30 June 2022, the company had a total of 1.1 crore shares outstanding.

    On 5 January 2023, Page Industries shares prices were Rs 42,177.95 and Rs 42,177.45 on NSE and BSE, respectively. The share price touched a 52-week high of Rs 54,349.10 and a 52-week low of Rs 37,825.00. Its three-month return to investors was -19.4%, while its one-year return was 2.25%.

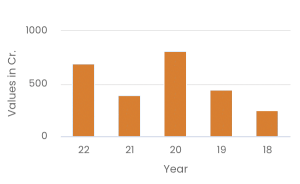
    SBI Focused Equity Direct-G is a mutual fund that has invested a sum of Rs 901 crore in Page Industries. Other mutual funds with an investment in Page Industries include SBI Bluechip Direct-G (with an investment of Rs 616 crore) and SBI Equity Hybrid Direct-G (with an investment of Rs 604 crore).

    In the second quarter of FY23, the company reported an increase in revenue of 16% compared to the same period last year. The company also reported that its EBITDA had increased by 2% compared to the same period last year.

    Disclaimer: ICICI Securities Ltd. (I-Sec). Registered office of I-Sec is at ICICI Securities Ltd. - ICICI Venture House, Appasaheb Marathe Marg, Prabhadevi, Mumbai - 400 025, India, Tel No : 022 - 6807 7100. I-Sec is a Member of National Stock Exchange of India Ltd (Member Code: 07730), BSE Ltd (Member Code: 103) and Member of Multi Commodity Exchange of India Ltd.(Member Code: 56250) and having SEBI registration no. INZ000183631. Name of the Compliance officer (broking): Ms. Mamta Shetty, Contact number: 022-40701022, E-mail address: complianceofficer@icicisecurities.com. Investments in securities market are subject to market risks, read all the related documents carefully before investing. The contents herein above shall not be considered as an invitation or persuasion to trade or invest. I-Sec and affiliates accept no liabilities for any loss or damage of any kind arising out of any actions taken in reliance thereon. Such representations are not indicative of future results. The securities quoted are exemplary and are not recommendatory. Investors should consult their financial advisers if in doubt about whether the product is suitable for them. The contents herein above are solely for informational purpose and may not be used or considered as an offer document or solicitation of offer to buy or sell or subscribe for securities or other financial instruments or any other product. Investors should consult their financial advisers whether the product is suitable for them before taking any decision. The contents herein mentioned are solely for informational and educational purpose.

Registered Address

Cessna Business Park Tower-1, 7th Floor Umiya Business Bay, Bengaluru, Karnataka, 560103

Tel : 91-80-49454545
Email : investors:jockeyindia.com; info:jockeyindia.com
Website : http://www.pageind.com
Registrar

Sharepro Services India P Ltd

AGM Date (Month) : Aug
Face Value Equity Shares : 10
Market Lot Equity Shares : 1
BSE Code : 532827
NSE Code : PAGEIND
Book Closure Date (Month) : Aug
BSE Group : A
ISIN : INE761H01022

FAQ’s on Page Industries Ltd Shares

You can buy Page Industries Ltd shares through a brokerage firm. ICICIdirect is a registered broker through which you can place orders to buy Page Industries Ltd Share.

Company share prices and volatile and keep changing according to the market conditions. As of Apr 19, 2024 03:52 PM the closing price of Page Industries Ltd was ₹ 35,391.40.

Market capitalization or market cap is determined by multiplying the current market price of a company’s shares with the total number of shares outstanding. As of Apr 19, 2024 03:52 PM, the market cap of Page Industries Ltd stood at ₹ 39,475.57.

The latest PE ratio of Page Industries Ltd as of Apr 19, 2024 03:52 PM is 73.09

The latest PB ratio of Page Industries Ltd as of Apr 19, 2024 03:52 PM is 0.04

The 52-week high of Page Industries Ltd share price is ₹ 43,570.00 while the 52-week low is ₹ 33,070.05

According to analyst recommendations, Page Industries Ltd Share has a “Buy” rating for the long term.

Download Our

Download App
market app