loader2
Partner With Us NRI

P I Industries Ltd share Price Today

Company details

3,700.00
3,795.50
3,015.00
4,040.00
6M Return 6.19%
1Y Return 22.19%
Mkt Cap.(Cr) 56,386.75
Volume 244,652
Div Yield 0.27%
OI
-
OI Chg %
-
Volume 244,652

Open Free Trading Account Online with ICICIDIRECT

Incur '0' Brokerage upto ₹500
CSM continues to drive growth; domestic flat…
About The Stock

    Incorporated in 1947, PI Industries focuses on complex chemistry solutions in agri and pharma sciences.

    • The company maintains a strong research presence through its R&D facility in Udaipur, where it has a dedicated team of over 300 scientists
    • The revenues of the company can be divided into custom synthesis manufacturing (CSM) and domestic agrochem formulation business with the former contributing ~74% to overall revenue in FY22 and the rest coming from the domestic formulations business
Q3FY23

    Numbers were in line with I-direct estimates on revenue front while EBITDA and PAT came in above I-direct estimates due to favourable product mix, higher-than-expected other income and low tax rate.

    • Reported revenue growth of 19% YoY to ₹ 1613.2 crore. CSM was up 23% YoY to ₹ 1328.6 crore while domestic formulation was up 2% YoY to ₹ 285 crore
    • Gross margins grew 73 bps YoY to ~47.2% while EBITDA margin expanded 387 bps YoY to 25.7%. Absolute EBITDA was up 40% YoY to ₹ 415.1 crore
    • PAT increased 58% YoY to ₹ 351.8 crore, driven by strong operational efficiency

Click here for full recommendation

Research view on more stocks

Agrochemicals company PI Industries announced Q1FY24 results:

  • Revenue of Rs 15,432 million in Q1FY23 compared to Rs 19,104 million in Q1FY24, up 24% YoY
  • Gross margin of 44% in Q1FY23 compared to 47% in Q1FY24, up 267 bps YoY
  • Overheads of Rs 3,310 million in Q1FY23 compared to Rs 4,208 million in Q1FY24, up 27% YoY
  • EBITDA of Rs 3,495 million in Q1FY23 compared to Rs 4,726 million in Q1FY24, up 35% YoY
  • EBITDA as % of Revenue of 23% in Q1FY23 compared to 25% in Q1FY24, up 209 bps YoY
  • Net Profit of Rs 2,624 million in Q1FY23 compared to Rs 3,829 million in Q1FY24, up 46% YoY
  • Total capex for Q1FY24 is Rs 6,490 million including Pharma acquired assets of Rs 5,249 million through business combination. The capex excluding this addition is Rs 1,241 million (Q1FY23 Rs 506 million).


Result PDF

View Other Company Results

P I Industries Ltd shares SWOT Analysis

Strengths (10)

  • Rising Net Cash Flow and Cash from Operating activity
  • Company with high TTM EPS Growth
  • Efficient in managing Assets to generate Profits - ROA improving since last 2 year

Weakness (2)

  • MFs decreased their shareholding last quarter
  • Decline in Net Profit (QoQ)

Opportunity (0)

Data not found

Threats (1)

  • Increasing Trend in Non-Core Income

Resistance and support

R1 3,774.7
R2 3,832.9
R3 3,870.2
Pivot

3,737.35

S1 3,679.2
S2 3,641.9
S3 3,583.7
EMA SMA
3,793.5
3,703.6
3,633.5
3,563.3
3,813.8
3,674.6
3,593.4
3,601.6
Delivery and volume
CLIENT NAME DEAL TYPE ACTION DATE AVG. PRICE QUANTITY EXCHANGE
ISHARES CORE MSCI EMERGING MARKETS ETF Block Purchase 2022-11-14 3434.95 109358 NSE
ISHARES CORE EMERGING MARKETS MAURITIUS CO Block Sell 2022-11-14 3434.95 109358 NSE
ISHARES CORE MSCI EMERGING MARKETS ETF Block Purchase 2022-11-03 3257.25 109358 BSE
Name Category Shares
MAYANK SINGHAL PROMOTER 20.45%
MADHU SINGHAL PROMOTER 17.53%
SALIL SINGHAL PROMOTER 8.11%

OUR RESEARCH VIEW

Investment recommendation
CSM continues to drive growth; domestic flat…
Call Date
20 Feb 2023
Entry Price 3,114.00
Target Price 3,615.00
Duration
12-18 Month

FINANCIALS

Sales
Operating Profit
Profit after Tax
Equity
Reserves and Surplus
Debt
Sales
Operating Profit
Profit after Tax
PE
Debt/Equity
P BV

P I Industries Ltd Stocks COMPARISON

Financials( in Cr) P I Industries Ltd UPL Ltd Bayer CropScience Ltd Sumitomo Chemical India Ltd Dhanuka Agritech Ltd
Price 3,716.55 478.40 5,552.20 399.85 1,265.40
% Change -0.69 -1.29 3.48 2.74 3.43
Mcap Cr 56,386.75 35,909.09 24,952.70 19,958.35 5,767.44
Revenue TTM Cr 6,492.00 53,576.00 5,139.70 3,510.97 1,700.22
Net Profit TTM Cr 1,229.50 4,414.00 758.20 502.21 233.50
PE TTM 35.66 0.00 30.18 58.59 22.66
1 Year Return 22.19 -35.10 35.05 -5.56 96.00
ROCE 21.56 15.20 32.05 29.85 28.87
ROE 18.46 16.20 25.91 23.31 23.10
INSIDER & INSTITUTIONAL ACTIVITY

Equity Capital: 7,198.50 Cr FV: 1.00

Period MF Net Purchase / (sold) FII Net
LAST 1M 30,652.90 -6,308.76
LAST 3M 83,407.71 39,149.62
LAST 6M 140,394.95 70,735.56
LAST 12M 215,381.38 197,679.38

P I Industries Ltd Information

Stock PE (TTM)
35.66
Promoter Holding
46.09%
Book Value
526.1054
ROCE
21.56%
ROE
18.46%
Description
  • P I Industries Limited is a holding company for various group entities involved in the manufacturing and marketing of several types of agricultural chemicals. The company primarily has two product categories: agricultural chemicals (pesticides, fungicides, and insecticides) and specialty products. The company has its headquarters in Udaipur, Rajasthan. The company has been operating since 1946.

    On 5 January 2023, the market capitalisation of P I Industries Limited was Rs 50,412.10 crore, and it reported consolidated sales of Rs 1,696 crore at the end of September 2022.

    The company is listed on the Bombay Stock Exchange with the code 523642 and the National Stock Exchange with the code PIIND. On 30 September 2022, the company’s shareholding pattern indicated a promoter stake of 46.09%, a 0% stake of foreign institutional investors, and a public stake of 27.9%. The company’s shareholding pattern has remained largely the same over the past year, with the promoters divesting some shares while domestic mutual funds increase their holdings. 

    The company’s board of directors consists of Salil Singhal, Narayan K Seshadri, Mayank Singhal, Rajnish Sarna, Arvind Singhal, Lisa J Brown, Pravin K Laheri, Ramni Nirula, and T S Balganesh. Price Waterhouse Chartered Accountants LLP are the company’s auditors. On 30 September 2022, the company had a total of 12 crore shares outstanding.

    On 5 January 2023, P I Industries’ share prices were Rs 3,322.75 and Rs 3,322.85 on NSE and BSE, respectively. The share price touched a 52-week high of Rs 3,698.45 and a 52-week low of Rs 2,333.55. Its three-month return to investors was 9.2%, while its one-year return was 10.8%.   

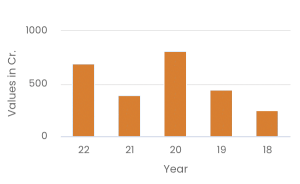
    As of November 2022, Axis Long Term Equity Direct-G had invested Rs 1099 crore in the company, while Kotak Emerging Equity Direct-G and Axis Midcap Direct-G had invested Rs 733.5 and Rs 589.2 crore, respectively.

    In the second quarter of FY23, the company reported that it had achieved a 31% revenue growth compared to the same period last year. A large portion of the growth came from exports which increased by 29%. The company’s domestic operations also grew by 36% during the same period. 

    Disclaimer: ICICI Securities Ltd. (I-Sec). Registered office of I-Sec is at ICICI Securities Ltd. - ICICI Venture House, Appasaheb Marathe Marg, Prabhadevi, Mumbai - 400 025, India, Tel No : 022 - 6807 7100. I-Sec is a Member of National Stock Exchange of India Ltd (Member Code: 07730), BSE Ltd (Member Code: 103) and Member of Multi Commodity Exchange of India Ltd.(Member Code: 56250) and having SEBI registration no. INZ000183631. Name of the Compliance officer (broking): Ms. Mamta Shetty, Contact number: 022-40701022, E-mail address: complianceofficer@icicisecurities.com. Investments in securities market are subject to market risks, read all the related documents carefully before investing. The contents herein above shall not be considered as an invitation or persuasion to trade or invest. I-Sec and affiliates accept no liabilities for any loss or damage of any kind arising out of any actions taken in reliance thereon. Such representations are not indicative of future results. The securities quoted are exemplary and are not recommendatory. Investors should consult their financial advisers if in doubt about whether the product is suitable for them. The contents herein above are solely for informational purpose and may not be used or considered as an offer document or solicitation of offer to buy or sell or subscribe for securities or other financial instruments or any other product. Investors should consult their financial advisers whether the product is suitable for them before taking any decision. The contents herein mentioned are solely for informational and educational purpose.

Registered Address

Post Box No 20, Udaisagar Road, Udaipur, Rajasthan, 313001

Tel : 91-294-2492451-55
Email : investor:piind.com
Website : http://www.piindustries.com
Registrar

Karvy Computershare Pvt Ltd

AGM Date (Month) : Aug
Face Value Equity Shares : 1
Market Lot Equity Shares : 1
BSE Code : 523642
NSE Code : PIIND
Book Closure Date (Month) : Aug
BSE Group : A
ISIN : INE603J01030

FAQ’s on P I Industries Ltd Shares

You can buy P I Industries Ltd shares through a brokerage firm. ICICIdirect is a registered broker through which you can place orders to buy P I Industries Ltd Share.

Company share prices and volatile and keep changing according to the market conditions. As of Apr 18, 2024 03:56 PM the closing price of P I Industries Ltd was ₹ 3,716.55.

Market capitalization or market cap is determined by multiplying the current market price of a company’s shares with the total number of shares outstanding. As of Apr 18, 2024 03:56 PM, the market cap of P I Industries Ltd stood at ₹ 56,386.75.

The latest PE ratio of P I Industries Ltd as of Apr 18, 2024 03:56 PM is 35.66

The latest PB ratio of P I Industries Ltd as of Apr 18, 2024 03:56 PM is 0.14

The 52-week high of P I Industries Ltd share price is ₹ 4,040.00 while the 52-week low is ₹ 3,015.00

According to analyst recommendations, P I Industries Ltd Share has a “Buy” rating for the long term.

Download Our

Download App
market app